By joern kunze - Thursday, April 28, 2016
Hi Experts,
when I apply a Zoom-Control to a HeatMapChart, basically it works. But after zooming in, the Chart now fills the entire Chart panel:
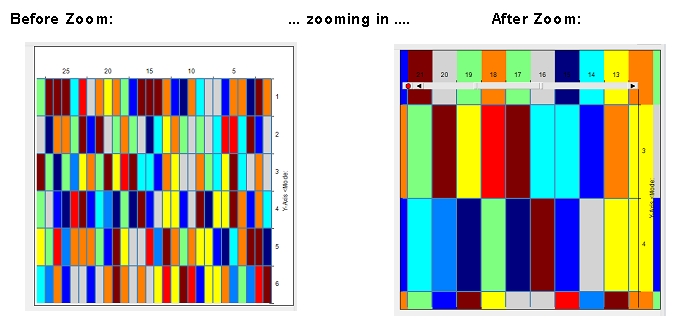
The zoom functionality is implemented for various other Chart Types (line, point, bar...) in the same way - but none of the other Chart Types shows this behaviour. How can I force the HeatMapChart to fill the Chart panel only within the axis-bounds ?
Thanks for the help,
Joern
|
By Nevron Support - Thursday, May 5, 2016
Hello Joern,
We have just released a SP (new installation package build version: 16.5.5.12) which fixes this issue.
|
By joern kunze - Tuesday, May 10, 2016
... thanks for the update - now the Zoom with HeatMap-Chart works as expected!
Best regrads,
Joern
|
|