By Lance Levendowski - Tuesday, May 3, 2016
Legend items can appear blurry or clipped when NChartControl.Settings.RenderSurface = window.
Can this be prevented?
Run the following example to reproduce the issue. Notice that the clipping of text in the legend depends on the size of the NChartControl.
Public Class LegendForm
Inherits Windows.Forms.Form
Private _ChartControl1 As Nevron.Chart.WinForm.NChartControl
Private WithEvents _CheckBox1 As Windows.Forms.CheckBox
Public Sub New()
Call InitializeControls()
End Sub
Private Sub InitializeControls()
Me.Size = New Drawing.Size(640, 392)
Me.StartPosition = FormStartPosition.CenterScreen
Dim lowResolutionDataSize As New Drawing.Size(20, 20)
Dim highResolutionDataSize As New Drawing.Size(255, 255)
Const renderSurface As Nevron.GraphicsCore.RenderSurface = Nevron.GraphicsCore.RenderSurface.Window
Const shadingMode As Nevron.Chart.ShadingMode = Nevron.Chart.ShadingMode.Smooth
Const triangulationMode As Nevron.Chart.MeshSurfaceCellTriangulationMode = Nevron.Chart.MeshSurfaceCellTriangulationMode.MaxDiagonal
Dim chartBounds As New Drawing.Rectangle(0, 0, Me.ClientSize.Width, Me.ClientSize.Height - 24)
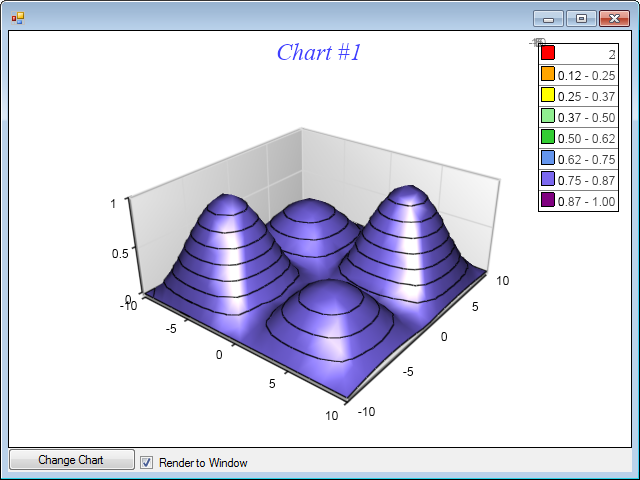
Me._ChartControl1 = Tools.CreateChartControlWithMeshSurface(Me, "Low Res ZoneTexture", chartBounds, True, renderSurface, shadingMode, triangulationMode, lowResolutionDataSize)
Me._ChartControl1.Anchor = AnchorStyles.Left Or AnchorStyles.Top Or AnchorStyles.Right Or AnchorStyles.Bottom
Me._CheckBox1 = New Windows.Forms.CheckBox
Me._CheckBox1.Text = "Render to Window"
Me._CheckBox1.Location = New Drawing.Point(0, Me._ChartControl1.Bottom)
Me._CheckBox1.AutoSize = True
Me._CheckBox1.Anchor = AnchorStyles.Left Or AnchorStyles.Bottom
Me._CheckBox1.Checked = (Me._ChartControl1.Settings.RenderSurface = Nevron.GraphicsCore.RenderSurface.Window)
Me.Controls.Add(Me._CheckBox1)
End Sub
Private Sub _CheckBox1_CheckedChanged(sender As Object, e As System.EventArgs) Handles _CheckBox1.CheckedChanged
If (Me._CheckBox1.Checked) Then
Me._ChartControl1.Settings.RenderSurface = Nevron.GraphicsCore.RenderSurface.Window
Else
Me._ChartControl1.Settings.RenderSurface = Nevron.GraphicsCore.RenderSurface.Bitmap
End If
End Sub
End Class
|
By Nevron Support - Thursday, May 5, 2016
Hi Lance,
We could not replicate the problem using the provided code below - please send an app replicating the problem to support@nevron.com. Also we were unable to replicate this problem using the standard examples shipped with the control.
|
By Lance Levendowski - Thursday, May 5, 2016
Please try my example using a DPI setting of 125% and let me know if that allows you to reproduce the issue. The resolution of my screen is 1920 x 1080.
|
By Nevron Support - Monday, May 9, 2016
Hi Lance,
In order to be printable most chart properties related to line width are specified in points (instead of pixels). Depending on the resolution this width may not be a number which is an exact round to pixel. To workaround this you can specify pixel width to legend grid lines - for example:
legend.HorizontalBorderStyle.Width = new NLength(1, NGraphicsUnit.Pixel);
legend.VerticalBorderStyle.Width = new NLength(1, NGraphicsUnit.Pixel);
legend.OuterLeftBorderStyle.Width = new NLength(1, NGraphicsUnit.Pixel);
legend.OuterRightBorderStyle.Width = new NLength(1, NGraphicsUnit.Pixel);
legend.OuterTopBorderStyle.Width = new NLength(1, NGraphicsUnit.Pixel);
legend.OuterBottomBorderStyle.Width = new NLength(1, NGraphicsUnit.Pixel);
Hope this helps - let us know if you meet any problems or have any questions.
|
By Lance Levendowski - Monday, May 9, 2016
Thank you for the feedback. I tried setting the BorderStyle.Width properties that you listed to "new NLength(1, NGraphicsUnit.Pixel)", but that did not prevent text in the legend from being clipped.
Were you able to reproduce the issue using my example code with a DPI setting of 125%?
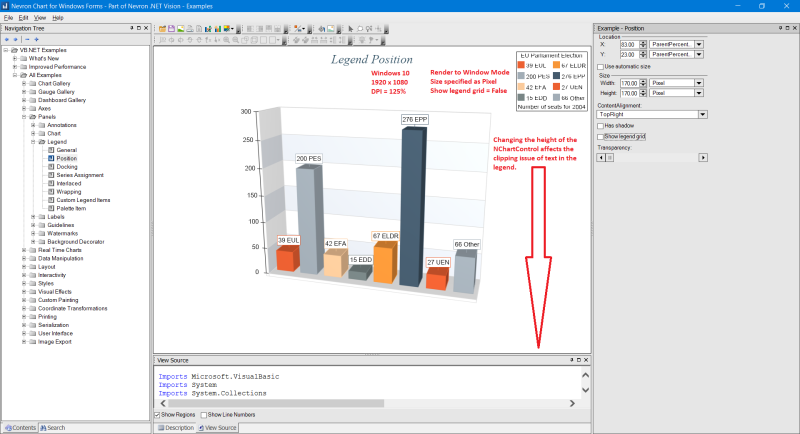
I've also noticed that the size of the NChartControl affects the issue. For example, if I run my example code then the top of text in the legend is clipped. If I increase the size of the form then text in the legend is no longer clipped. But, if I keep increasing the size of the form then text in the legend becomes clipped again.
The same is true if I run "All Examples - Panels - Legend - Position" and set the chart's Render Surface to Window (see screen shot).
|
By Nevron Support - Wednesday, May 11, 2016
Hi Lance,
We still cannot reproduce this problem - we tested with 125% dpi on a Win7 machine using the latest version and there was no text clipping - what is the version you're currently testing with? Also what is the version of Windows?
|
By Lance Levendowski - Wednesday, May 11, 2016
The issue exists in builds 16.4.15.12 and 16.5.9.12.
System Specs:
Windows 10 Pro x64
Intel Core i7-4790K
Geforce GTX 980M (Driver 365.10-notebook-win10-64bit)
32 GB RAM
1920 x 1080
125% DPI
|
By Nevron Support - Monday, May 16, 2016
Hi Lance,
This issue is most likely related to the video board as we were unable to reproduce it on Win7/Win10 machines. Do you experience this behavior on other machines as well?
|
By Lance Levendowski - Wednesday, May 18, 2016
You are correct that this issue seems to be dependent on the video card.
I tested my sample code on several computers and here are the results:
1. GeForce GTX 760, Windows 10 x64 - Legend text is clipped at various chart sizes as it is on the GeForce GTX 980M
2. Old Notebook with Radeon Video Card, Windows 10 x64 - No issues with the Legend.
3. Desktop using Intel HD Graphics 4000, Windows 7 x64 - Several characters in the Legend are displaced to the top-left corner, most other characters appear washed out (see image).
Hope this helps. Please let me know if you need any more information.
|
By Lance Levendowski - Monday, June 13, 2016
Can you please give me an update on this issue?
Thank you.
|
By Nevron Support - Tuesday, June 14, 2016
Hi Lance,
We don't have any of the problematic video boards here - the controls were tested primary on the Intel based video boards and some ATI models and we have had very little complaints about the hardware accelerated rendering most of which were fixed after the latest video board drivers are installed (which leads us to think that those issues are caused by the particular OpenGL implementation). We're going to perform tests this week on the Radeon R9 series of video boards and will let you know if we find issues with ATI drivers.
|
By Lance Levendowski - Tuesday, June 14, 2016
Thanks for the feedback. I doubt you'll have issues with the Radeon R9 series because this issue did not occur on the Radeon system that I tested. So far this issue has occurred on every GeForce system that I've tested (GTX 760, GTX 970, and GTX 980M), all of which were running Windows 10 x64 and had updated drivers. As I reported, I also have an issue on a system with Intel HD Graphics 4000 and Windows 7 x64.
Is there any way for you to test on a GeForce system?
|
By Nevron Support - Wednesday, June 29, 2016
Hi Lance,
We tested on an older Nvidia GeForce (650 Ti) and everything worked OK... we'll also will try to find one of the boards you experience problems with...
|
By Lance Levendowski - Friday, July 1, 2016
Thanks for the update and for testing it with a GeForce.
Did you try my sample code with a DPI setting of 125%? You might have to resize the form (which resizes the chart) in order to notice the clipping of legend text. I’m using Windows 10 x64, but I'm not sure if that matters.
|
|