By bee4guy 143 - Sunday, July 31, 2016
Dear Support,
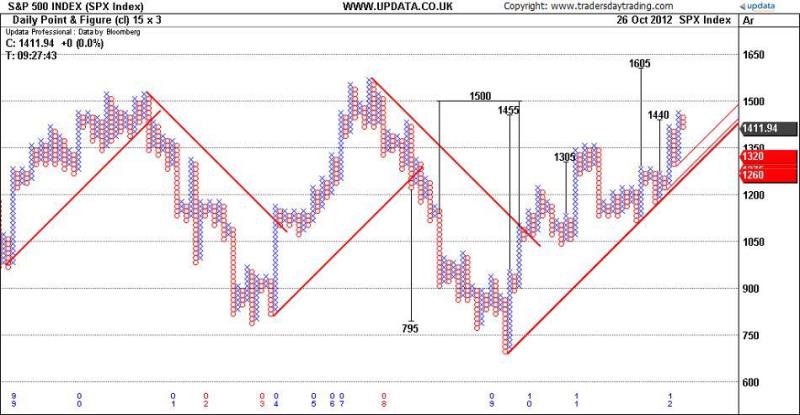
I want to draw chart (Point and figure with Trend lines & Target) as shown in screenshot, Can you please guide me to draw the trend lines, target & stop loss lines on point and figure chart, I am able to draw the point and figure charts. If possible Please provide the same code in c#.net with asp.net or else guide me.
Thanks in Advance
Deepoo
|
By Niranjan Singh - Tuesday, August 2, 2016
Hi,
I suggest you to go through the Line Studies documentation and also the Knowledge base example for chart here . There are few example which are shown for the Sharepoint but little bit helpful to understand that how to create trend line using the lines..
Hope this help..
Niranjan
|
By Nevron Support - Wednesday, August 3, 2016
Hi Deepo,
You can also take a look at the custom drawing example (All Examples \ Custom Painting). This group of examples show different techniques of painting over the chart. If you meet any problems or have any questions just let us know.
|
|