By joern kunze - Wednesday, April 5, 2017
Hi Experts,
I have a chart with one or more NFloatBarSeries (Chart is rotated 270degrees):
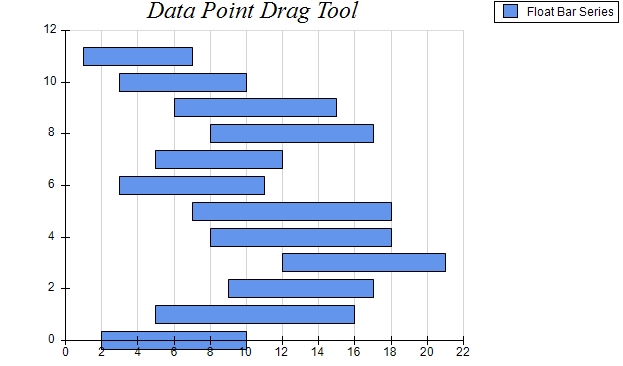
I have also added mouse interactivity to move the left border of a data-pair (using NDataPointDragTool) => this is working well.
But now I want to add some more mouse interactivity:
1. Change right border of a data-pair:
2. Shift an entire data-pair up or down (which means to assign it to another X-axis-Value)
3. Shift an entire data-pair to the left or right (which means to add a constant to both values of the data-pair)
Thanks for help!
Joern
|
By Nevron Support - Monday, April 10, 2017
Hi Joern,
Just a short note that we've implemented this functionality in the upcoming 2017.1 release which should be live next month. Let us know if that is Ok with your schedule.
|
|