By Vahid Mesri - Monday, June 19, 2017
Hi,
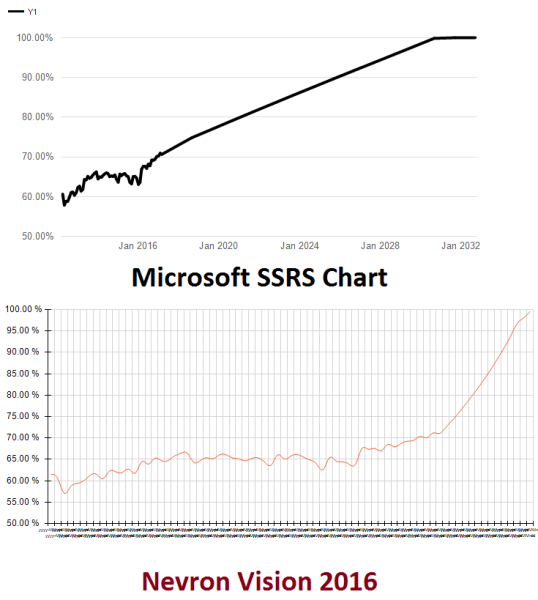
In my smooth-line plot, the x-values are dates and the y-values are percentages.
The issue is that I have monthly values at the beginning section of my plot, however, after two years, the dates are updated on yearly basis, therefore the dates do not have consistent intervals.
Please find attached the plot I've created using the Microsoft chart control. I would like to use Nevron to reproduce this plot but unfortunately it treats the dates as categories and not datetime variables.
Thanks a lot for your help 
|
By Nevron Support - Wednesday, June 21, 2017
Hello Vahid,
What is the data type for the X axis - are you using Date Time or String values?
You should be able to switch the Smooth Line - Sub Type to: XY Scatter. Then in the Values Grouping Editor, you need to pass the X value (for example: =Fields!Date.Value).
From the Chart Areas -> Axes -> Primary X -> Scale tab, from Numeric tab, you can choose Date Time sub type and you can configure the formatting. You can check some of the report examples shipped with the installation (for example: CalculatedSeries_PolynomialRegression.rdl).
Hopefully this helps. Let us know if you have any questions or if you need assistance.
|
By Vahid Mesri - Tuesday, July 4, 2017
Thanks a lot for your reply. Indeed, changing the plot sub type to XY scatter did solve my problem, however, no I'm experiencing a new issue with x-axis labels.
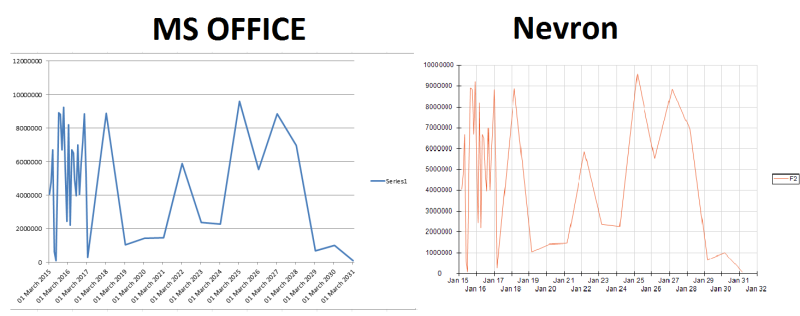
I would like to reproduce the plot on the left-side using Nevron
The issue is that the x-axis in my data (testData.csv) consists of dates commencing from March 2015 but Nevron selects Jan 2015 when generating the labels automatically. Please note that the time-differences between the dates are not equal.
Even when I set the x-axis scale to have custom steps and set the start range of my plot to March 2015, the generated lables in Nevron begin from January 2015 (and not March).
Thanks alot
p.s. I've attached the csv and rdl. to replicate, please remove the ".txt" extension and copy the csv file to "c:\rep"
|
By Nevron Support - Tuesday, July 4, 2017
Hello Vahid,
This is caused by the default axis scaling. You can use the following custom C# code:
using System;
using System.Drawing;
using Nevron.GraphicsCore;
using Nevron.Chart;
using Nevron.ReportingServices;
namespace MyNamespace
{
/// <summary>
/// Sample class
/// </summary>
public class MyClass
{
/// <summary>
/// Main entry point
/// </summary>
/// <param name="context"></param>
public static void RSMain(NRSChartCodeContext context)
{
NChart chart = context.document.Charts[0];
NDateTimeScaleConfigurator dateTimeScale = chart.Axis(StandardAxis.PrimaryX).ScaleConfigurator as NDateTimeScaleConfigurator;
if (dateTimeScale != null)
{
bool hasMin = false;
DateTime minValue = new DateTime();
foreach (NSeriesBase series in chart.Series)
{
NXYScatterSeries xyScatter = series as NXYScatterSeries;
if (xyScatter != null && xyScatter.XValues.Count > 0)
{
DateTime curXValue = DateTime.FromOADate((double)xyScatter.XValues[0]);
if (hasMin)
{
minValue = minValue < curXValue ? minValue : curXValue;
}
else
{
hasMin = true;
minValue = curXValue;
}
}
}
if (hasMin)
{
dateTimeScale.UseOrigin = true;
dateTimeScale.Origin = new DateTime(minValue.Year, minValue.Month, 1, 0, 0, 0);
}
}
}
}
}
|
|