By joern kunze - Tuesday, September 19, 2017
Hi Experts,
I have a ThinWebClient Chart with 2 Line Types with several series: NQuickPointSeries or NLineSeries. There is no mixed mode with the 2 series types it is either NQuickPointSeries or NLineSeries plotted.
The Legend for the chart is created with the following code:
NThinChartControl1.Legends.Clear();
NThinChartControl1.Legends.Add();
NLegend legend = NThinChartControl1.Legends[0];
legend.DockMode = PanelDockMode.Top;
legend.Padding = new NMarginsL(1, 1, 3, 3);
legend.FillStyle.SetTransparencyPercent(20);
legend.OuterBottomBorderStyle.Width = new NLength(1, NGraphicsUnit.Pixel);
legend.OuterLeftBorderStyle.Width = new NLength(1, NGraphicsUnit.Pixel);
legend.OuterRightBorderStyle.Width = new NLength(1, NGraphicsUnit.Pixel);
legend.OuterTopBorderStyle.Width = new NLength(1, NGraphicsUnit.Pixel);
legend.HorizontalBorderStyle.Width = new NLength(0, NGraphicsUnit.Pixel);
legend.VerticalBorderStyle.Width = new NLength(0, NGraphicsUnit.Pixel);
NThinChartControl1.Legends[0].VisibilityMode = VisibilityMode.Visible;
chart.DisplayOnLegend = legend;
For the NLineSeries everything is ok:
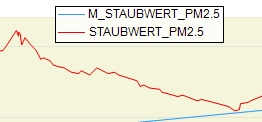
but for the NQuickPointSeries no coloured dot before the series name according to the series colour is shown:
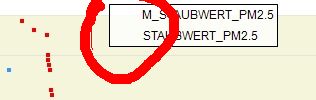
How do I force the coloured dots to be visible in the legend?
Thanks for the help,
Best regards,
Joern
|
By Nevron Support - Thursday, September 21, 2017
Hi Joern,
Thank you for pointing out this problem - we just release a SP which is published on our website which fixes it. Let us know if you meet any problems or have any questions.
|
|