By joern kunze - Monday, March 26, 2018
Hi Experts,
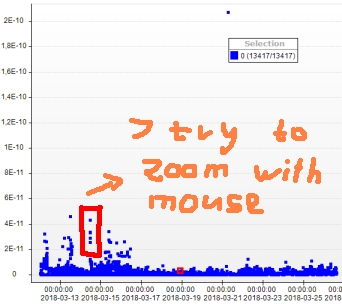
I have a Chart with a rather narrow total Y-Range:
-6.2E-12 ... 2.13E-10
When I use the normal zoom, the zoom is not recognized in the OnDataZoom_EndDrag event:
rangeTotal = oChart.Axis(StandardAxis.PrimaryY).ViewRange;
rangeZoomed = oChart.Axis(StandardAxis.PrimaryY).Scale.RulerRange;
now rangeTotal and rangeZoomed have both the same values (Y-Min and Y-Max for the total range).
When the Y-Range is better scaled (lets say from -10 ... 10) there is no problem, the rangeZoomed shows the mouse zoomed coordinates.
What can I do to make the zoom work even for very small total axis ranges ?
Thanks for your help,
best regards,
Joern
|
By Nevron Support - Tuesday, March 27, 2018
Hi Joern,
By default the NRangeSelection object has limitations on how small the zoom range can be. This is done to prevent numerical instability in the control that arises from double operations with very small ranges. The min zoom range is controlled from the MinHorizontalPageSize and MinVerticalPageSize properties of the range selection object. By default they are set to 0.000001.
Hope this helps - let us know if you meet any problems or have any questions.
|
By joern kunze - Wednesday, March 28, 2018
... thanks a lot for the advice, by adjusting rangeSelection.MinHorizontalPageSize / rangeSelection.MinVerticalPageSize I got it working properly.
By the way, maybe it would be a good idea if the Chart component could implement this automatically in a future version ?
Thanks again,
Best regards,
Joern
|
|