By joern kunze - Tuesday, April 2, 2019
Hi Experts,
I have a NHeatMapSeries plot which looks like:
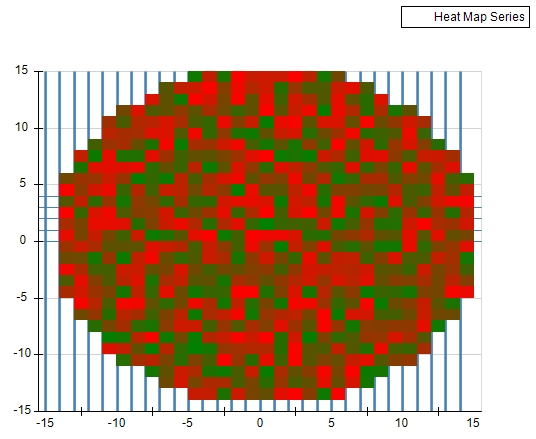
I have added NAxisConstLines for the X-Axis in the following way:
//--- Grid: Add constlines between single fields of HeatMap
if (true) {
for (int iX = (centerX * -1); iX < centerX; iX++) {
NAxisConstLine oBoarderLine = chart.Axis(StandardAxis.PrimaryX).ConstLines.Add();
oBoarderLine.StrokeStyle.Color = Color.SteelBlue;
oBoarderLine.StrokeStyle.Width = new NLength(2.0f);
oBoarderLine.FillStyle = new NColorFillStyle(new NArgbColor(255, Color.SteelBlue));
oBoarderLine.Value = iX;
}
}
How can I bring these Lines to a topmost plot level so that they appear visible over the heatmap ?
Thanks for your help,
best regards,
joern
|
By Nevron Support - Wednesday, April 3, 2019
Hi Joern,
You can tell the axes to display on the front chart wall - the following code shows how to achieve this with a simple bar chart:
NChart chart = nChartControl1.Charts[0];
NBarSeries bar = new NBarSeries();
bar.Values.Add(10);
bar.Values.Add(20);
bar.Values.Add(30);
chart.Series.Add(bar);
// transparent visible front wall
chart.Wall(ChartWallType.Front).Visible = true;
chart.Wall(ChartWallType.Front).FillStyle = new NColorFillStyle(Color.Transparent);
chart.Wall(ChartWallType.Front).BorderStyle.Width = new NLength(0);
// axis constline shows on the front wall only
NAxisConstLine constline = new NAxisConstLine();
constline.Value = 10;
constline.SetShowAtWall(ChartWallType.Back, false);
constline.SetShowAtWall(ChartWallType.Front, true);
chart.Axis(StandardAxis.PrimaryY).ConstLines.Add(constline);
Hope this helps - let us know if you have any questions or meet any problems.
|
By joern kunze - Wednesday, April 3, 2019
thanks a lot - making the front wall visible does the trick !
Best regards,
Joern
|
|