By joern kunze - Wednesday, April 3, 2019
Hi Experts,
when I use some data series with
nSeries.InflateMargins = true;
a zoom in the border area does not consider the extra margin (red square markes the area which is to be zoomed with the mouse):
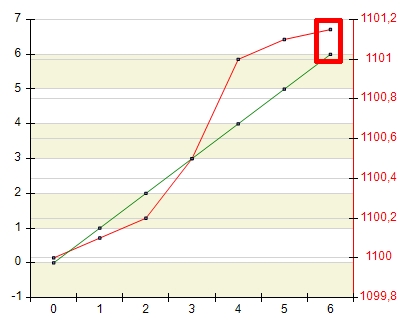
the result looks like:
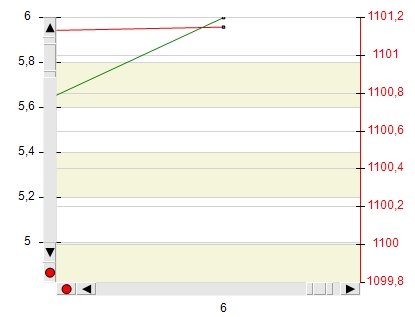
How can I achive that the extra margin is keept even when a zoom was applied (so the left Y-Axis should have a range from 5...7, not from 5...6) ?
Thanks for your help,
Best regards,
Joern
|
By Nevron Support - Thursday, April 4, 2019
Hi Joern,
Try using:
chart.Axis(StandardAxis.PrimaryX).UseRangeInflateWhenZoomed = true;
chart.Axis(StandardAxis.PrimaryY).UseRangeInflateWhenZoomed = true;
Let us know if you meet any problems.
|
By joern kunze - Thursday, April 4, 2019
... I did as you proposed and changed the UseRangeInflateWhenZoomed to true :
oChart.Axis(StandardAxis.PrimaryX).UseRangeInflateWhenZoomed = true;
oChart.Axis(StandardAxis.PrimaryY).UseRangeInflateWhenZoomed = true;
oChart.Axis(StandardAxis.SecondaryY).UseRangeInflateWhenZoomed = true;
Unfortunatly, this does not work when the 2nd series is assigned to the Secondary-Y-axis. When I assign both series to the primaryY axis it is working though.
If it is helpfull, I can send you my little demo project if you can not reproduce the issue.
|
By Nevron Support - Friday, April 5, 2019
Hi Joern,
Yes please send the demo app for review...
|
By joern kunze - Tuesday, April 16, 2019
Now I have prepared an example which shows several problems I do have with the zoom .
Case 1: Zoomed area does not exactly match the actual mouse zoomed area
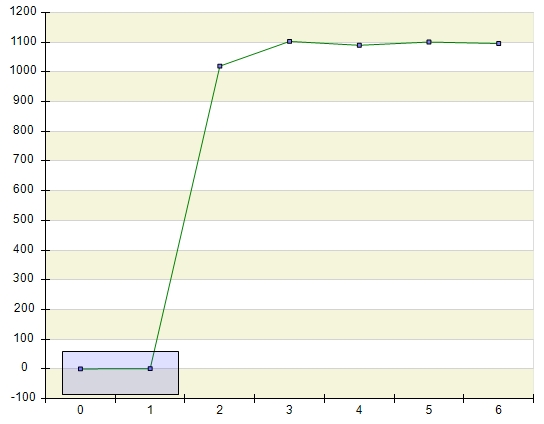
To reproduce start the attached example and press button "Test Zoom 1 Series" and zoom with the mouse the following range:
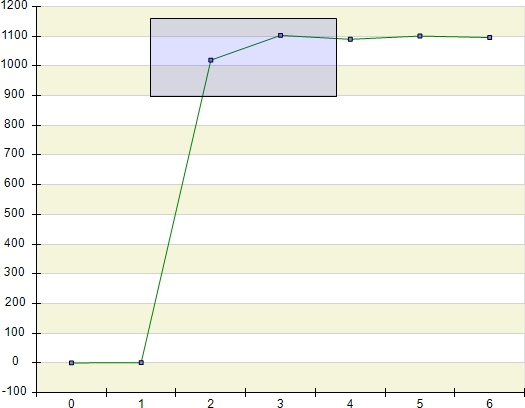
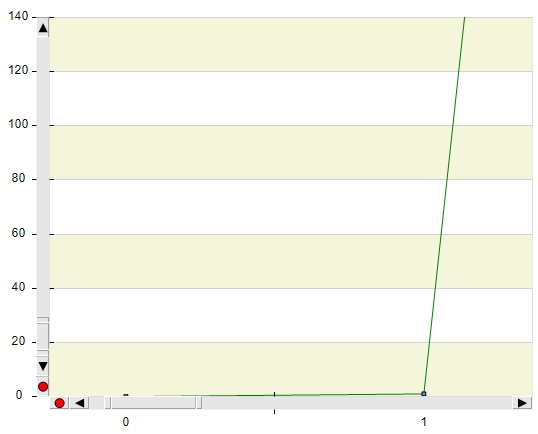
now the resulting plot starts with Y=800 instead with Y=900:
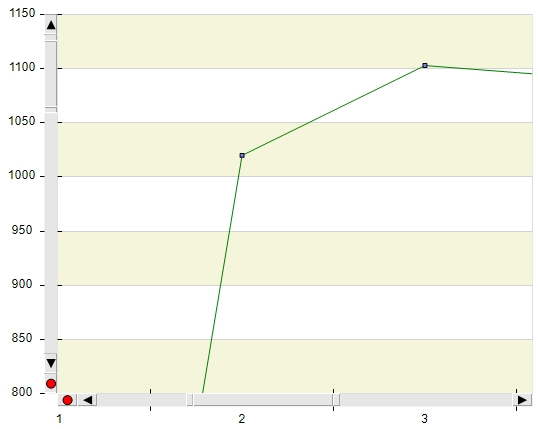
Note.
- the problem exists also when Series.InflateMargins=false
- This problem exists only if the zoom starts in the "extra margin" Y area of the plot (that means start zoom at Y >1100)
=> how can I avoid this behaviour ?
When Series.InflateMargins=true, a problem exists when zoom is applied to the lower Inflated Margin of the Y range:
Apply a mouse zoom like:
=> the resulting plot starts at Y= 0 instead of Y=-90:
Case 2: Similar to Case 1 - but now with Logarithmic Scale
To reproduce the problem, restart the project and press button "LogarithmicScale"
Now try the same like Case 1 and zoom starting within the extra margin area => now an additional problem occures:
oChart.Axis(StandardAxis.PrimaryY).PagingView.Enabled; returns false instead of true !!
(to see this, set a break at "// Case 2: Set break here and check bolYZoomActive" in frmMain.cs-On_DataZoom-EndDrag
=> when the zoom starts somewhere in the middle and not within the extra margin area, it works ok though.
Case 3: How to set zoom for logarithmic 2nd Y axis properly ?
Unfortunatly, I could not get the zoom-setting of the Y2-axis working properly.
Please start the project and press button "LogarithmicScale", then zoom like:
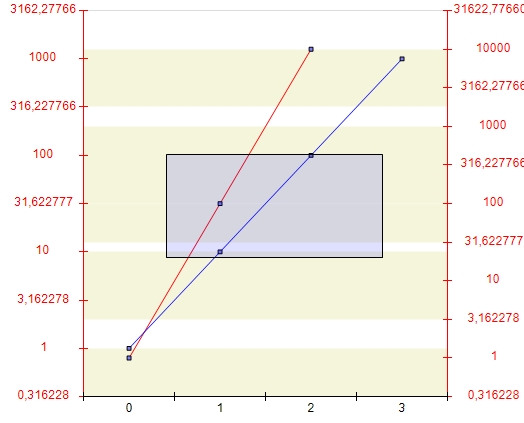
results in:
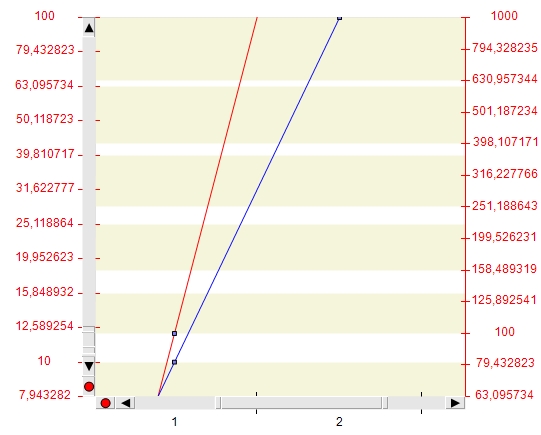
=> the left Y-axis looks ok, but the right Y2-axis is not scaled properly - probably my approach is wrong:
// compute the new range based on factor
NRange1DD axisContentRange = axis.ViewRange;
double rangeLength = axisContentRange.End - axisContentRange.Begin;
double begin = axisContentRange.Begin + beginFactor * rangeLength;
double end = axisContentRange.Begin + endFactor * rangeLength;
=> please see On_DataZoom_EndDrag-method of the attached example code.
Thanks very much for your help !
Best regards,
Joern
|
By Nevron Support - Friday, April 19, 2019
Hi Joern,
The chart is functioning as intended - simply put when you zoom in to a specified range that range is first clamped to the available axis content range and then extended to the nearest tick. You can work around the first problem by having a series with invisible values that are outside the original point range (for example one that has values -99 to 1199). For the second issue you cannot have synchronized zooming and tick inflate at the same time.
Hope this helps - let us know if you have any questions or meet any problems.
|
|