By Louis Miles - Tuesday, May 28, 2019
Hi all,
We are having an issue trying to create a line graph with Dates along the X Axis using Numerical instead of Categorical. When using Categorical it all works ok but when trying to render as Numerical we get the following
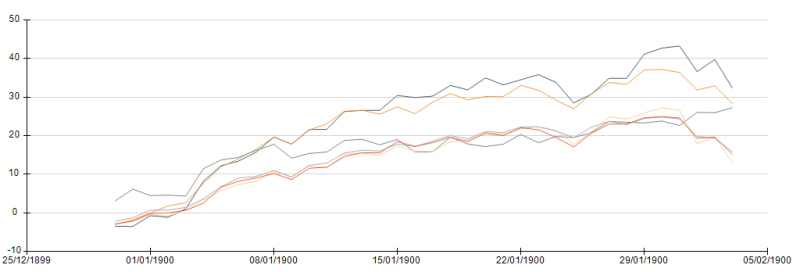
These dates should be from Jan 2016-August 2018 and not 1900 as the graph shows.
We have tried passing data through in a number of formats (yyyy-MM-dd, dd/MM/YYYY, including and excluding time) but it always seems to be misinterpreted as a number instead of a date.
Is there a setting we are missing to tell Nevron what format the dates will be in when they are passed in? Or do they need to be in a specific format?
Any help would be very gratefully accepted!
|
By Nevron Support - Tuesday, May 28, 2019
Hi Louis,
You need to specify that the line is in XY Scatter mode (from the series options). After you do that go to Value Grouping and assign the X value property which should be the date/time associated with each line data point. That way the line will also have date information - currently when you switch to date time numeric axis the line still uses categorical X values - 0, 1, 2 etc.In the case of the .NET date time format 0 maps to 1899 that's why you get dates around 1900. For example check out the Technical Price Indicators example where the line series is switched to XY Scatter.
Hope this helps - let us know if you meet any problems or have any questions.
|
By Louis Miles - Tuesday, May 28, 2019
Brilliant! That worked, thanks very much.
|
|