By joern kunze - Monday, September 2, 2019
Hi Experts,
after updating to Version 19.7 from Version 18.1 I am experiencing a problem when mixing NPointSeries with some NaN values and NLineSeries ("RefLine" in the following picture): the NaN values are drawn at an Y value between the adjacent valid Y-values of the serie:
oPlotSeries.Series_Label = "SeriesLabel";
oPlotSeries.X = new double[] { 1.1, 2.2, 3.3, 4.4 };
oPlotSeries.Y = new double[] { 10.1, double.NaN, double.NaN, 30.3 };
Plot_ReferenceLine oRefLine = new Plot_ReferenceLine(new double[] { 1.0, 2.2 }, new double[] { 15.0, 15.0 }, Color.Red, 3);
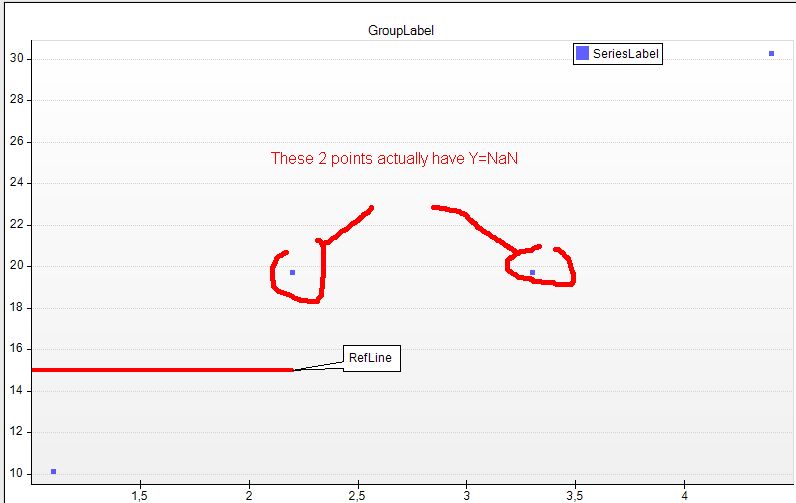
How can a avoid that NaN-Values are plotted ?
Thanks for your help,
Best regards,
Joern
|
By Nevron Support - Tuesday, September 3, 2019
Hi Joern,
The series is plotting data point markers for the valid data points and skips the data point markers for invalid ones. It is not possible to draw a segment between an invalid data point and a valid one so that's why the line does not appear but the markers do. This behavior is by design. You can easily disable markers on series level using:
line.MarkerStyle.Visible = false;
or by setting the marker style individually per data point:
NMarkerStyle emptyMarker = new NMarkerStyle();
emptyMarker.Visible = true;
emptyMarker.FillStyle = new NColorFillStyle(Color.Red);
line.MarkerStyles.Add(0, emptyMarker);
(note this will only work in case the line does not use sampling).
Let us know if you meet any problems.
|
By joern kunze - Wednesday, September 4, 2019
Thanks for your explaination - unfortunatly it does not really relate to the problem I have. I will try to explain the problem in more detail:
1. Plot of a single FastPointSeries (1 Series with 4 points, 2 of them are NaN) => this works good
FastPointSeriesCallback fastPoint1 = new FastPointSeriesCallback(...
fastPointSeries.XValues = new double[] { 1.1, 2.2, 3.3, 4.4 };
fastPointSeries.YValues = new double[] { 10.1, double.NaN, double.NaN, 30.3 };
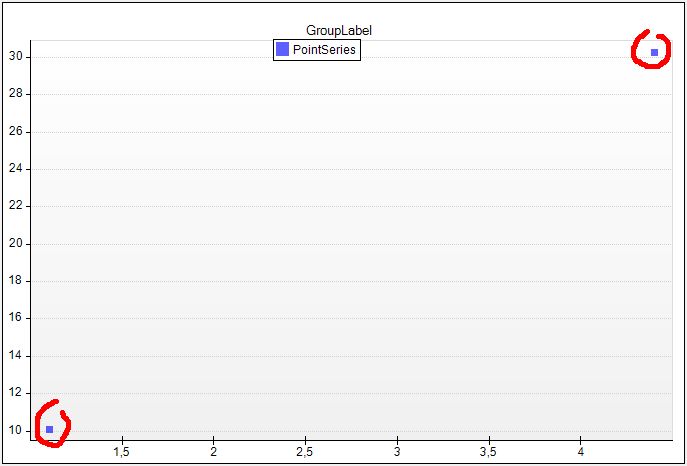
=> The chart just shows 2 points (I have added a red circle around the 2 points) - the 2 NaN points are not plotted. Thats exactly the expected and good behaviour.
2. Plot of FastPointSeries (1 Series with 4 points, 2 of them are NaN) A N D a NLineSeries => wrong plot
I do have exactly the same FastPointSeries as before - but now I want to display a NLineSeries as well.
Basically, the FastPointSeries and the NLineSeries have nothing to do with each other - they are just to be plotted independently within one Chart:
FastPointSeriesCallback fastPoint1 = new FastPointSeriesCallback(...
fastPointSeries.XValues = new double[] { 1.1, 2.2, 3.3, 4.4 };
fastPointSeries.YValues = new double[] { 10.1, double.NaN, double.NaN, 30.3 };
NLineSeries line = (NLineSeries)_oChart.Series.Add(SeriesType.Line);
line.UseXValues = true;
line.XValues.AddRange( new double[] { 2.0, 3.0 } );
line.Values.AddRange( new double[] { 15.0, 15.0 } );
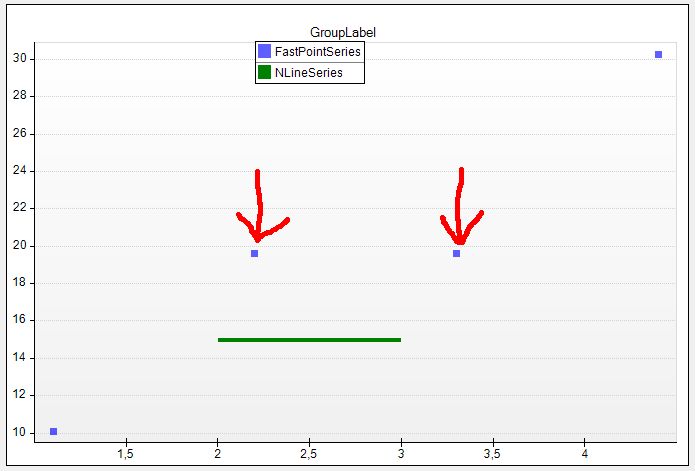
The NLineSeries is plotted as expected. But the 2 NaN points from the FastPointSeries are now plotted (I have added 2 red arrows to the picture for the NaN points) !! From where the Y-Values for the NaN points do come from is a mystery to me. In the previous version (I think I had 18.x before, this wrong behaviour did not occure).
How can I achieve that NaN values are not plotted by default as it was the case in the previous NevronChart Versions ?
I realize that this probably could be done manually - but this would be really awkward and probably expensive in terms of performance for large data sets.
Thanks for your help,
Best regards,
Joern
|
By Nevron Support - Monday, September 9, 2019
Hi Joern,
Thank you for reporting this problem - we just uploaded a SP that fixes the quick point rendering. Let us know if you meet any problems.
|
By joern kunze - Tuesday, September 10, 2019
... unfortunatly, it still doent work on my side. My be I can mail you the demo project so that you can have a look ? But since the demo project contains some internal stuff, I would like to mail it to you non public. Is there a mail address which I can use for that purpose ?
Thanks for your help,
Best regards,
Joern
|
By Nevron Support - Tuesday, September 10, 2019
Hi Joern,
Yes sure - please send the project to support@nevron.com.
|
|