By CHANGMIN KIM - Sunday, November 3, 2019
I have a NChart with a NChartControl.
I added three series to this NChart : two PointSeries, one GraphicsPathSeries.
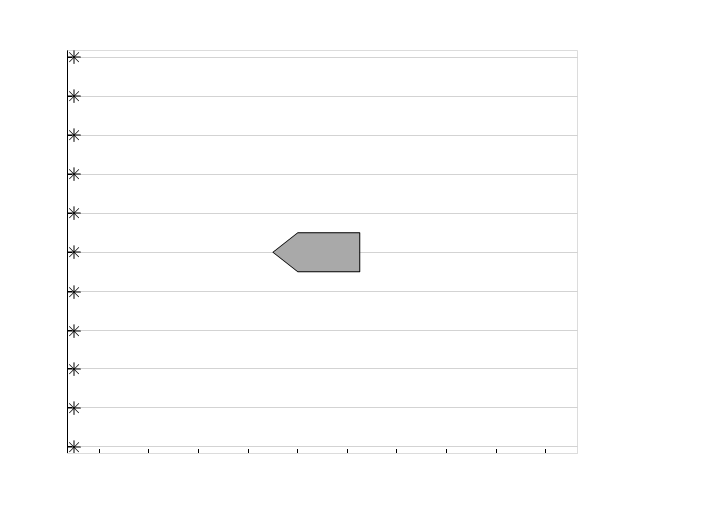
After adding some line segments to GraphicsPathSeries, I tried to add some datapoints to PointSeries.
But View of legend, header and axis which has been originally viewed good just disappeared.
Is it impossible to hold different type of chart series in one chart ?
Here is my Code :
NChart nChart = nChartControl1.Charts[0];
nChart.Axis(StandardAxis.Depth).Visible = false;
NPointSeries SeriesA = nChart.Series.Add(SeriesType.Point) as NPointSeries;
SeriesA.Size = new NLength(2, NRelativeUnit.ParentPercentage);
SeriesA.Name = "Series A";
SeriesA.PointShape = PointShape.Asterisk;
SeriesA.UseXValues = true;
SeriesA.DataLabelStyle.Visible = false;
SeriesA.FillStyle = new NColorFillStyle(Color.DarkKhaki);
SeriesA.InflateMargins = true;
NPointSeries SeriesB = nChart.Series.Add(SeriesType.Point) as NPointSeries;
SeriesB.Size = new NLength(2, NRelativeUnit.ParentPercentage);
SeriesB.Name = "Series B"
SeriesB.PointShape = PointShape.Diamond;
SeriesB.UseXValues = true;
SeriesB.DataLabelStyle.Visible = false;
SeriesB.FillStyle = new NColorFillStyle(Color.Red);
SeriesB.InflageMargins = true;
NGraphicsPathSeries SeriesC = nChart.Series.Add(SeriesType.GraphicsPath) as NGraphicsPathSeries;
SeriesC.Name = "Series C";
SeriesC.FillStyle = new NColorFillStyle(Color.DarkGray);
SeriesC.InflageMargins = true;
NAxis axisX = nChart.Axis(StandardAxis.PrimaryX);
NAxis axisY = nChart.Axis(StandardAxis.PrimaryY);
axisX.ScaleConfigurator.Title.Text = "X Axis";
axisY.ScaleConfigurator.Title.Text = "Y Axis";
axisX.ScaleConfigurator.Invert = true;
axisX.View = new NRangeAxisView(new NRange1DD(-1000.0, 1000.0), true, true);
axisY.View = new NRangeAxisView(new NRange1DD(-500, 500), true, true);
NGraphicsPath graphicsPath = new NGraphicsPath();
graphicsPath.AddLineSegment(new NPointD(2.0, 0.0), new NPointD(1.0, 1.0));
graphicsPath.AddLineSegment(new NPointD(1.0, 1.0), new NPointD(-1.5, 1.0));
graphicsPath.AddLineSegment(new NPointD(-1.5, 1.0), new NPointD(-1.5, -1.0));
graphicsPath.AddLineSegment(new NPointD(-1.5, -1.0), new NPointD(1.0, -1.0));
graphicsPath.AddLineSegment(new NPointD(1.0, -1.0), new NPointD(2.0, 0.0));
SeriesC.GraphicsPath = graphicsPath;
SeriesA.ClearDataPoints();
SeriesA.AddDataPoint(new NDataPoint(10, 10)); // This is when everything go disappear
SeriesA.AddDataPoint(new NDataPoint(20, 20));
...
...
|
By Nevron Support - Monday, November 4, 2019
Hi Kim,
Thank you for reporting this issue - we just published a SP fixing on the website. You need to download and reinstall .NET Vision in order to use the fixed dlls. Hope we helped - let us know if you meet any problems or have any questions.
|
By CHANGMIN KIM - Monday, November 4, 2019
It does not seem to be fixed.
Can you check it one more ?
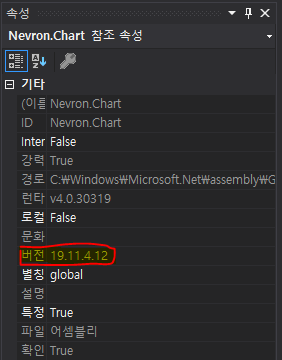
I let my VS to refer to latest version of Nevron Vision dll.
but same problem occurs.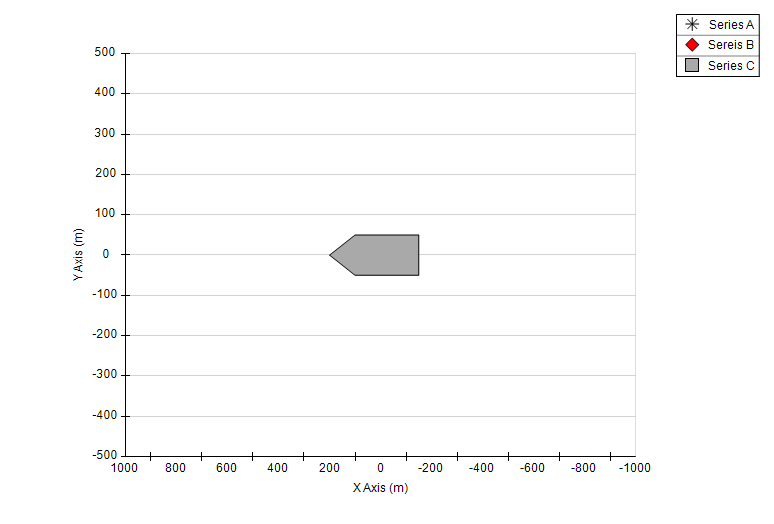
When I add datapoints to series A,
|
By Nevron Support - Tuesday, November 5, 2019
Hi Kim,
Can you send us the application you're testing it to support@nevron.com for further review.
|
By CHANGMIN KIM - Thursday, November 7, 2019
This problem is fixed after updating to Nevron Vision For .NET version 19.11.7.12.
Thanks ;-)
|
|