By shweta jain - Monday, June 15, 2020
Hello,
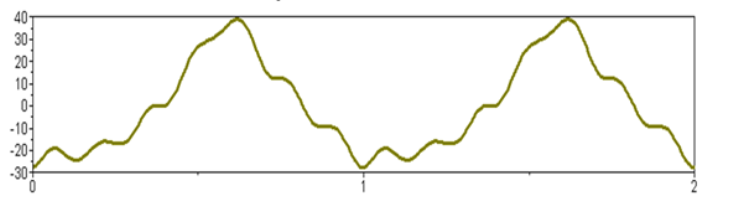
I want to Create chart like this attached snapshot. To create this chart, I have used NLineSeries but it is not plotting chart on given x-axis values 0-2. Please give me some idea, How can I create chart like this attached snapshot
|
By Nevron Support - Tuesday, June 16, 2020
Hi Sweta,
You can have a line series that assigns x values to each data point so that they are spaced at a lesser distance for example 0.1 if you intend to have 10 data points per category for example. The following code shows how to explicitly specify x value position for each data point:
line.UseXValues = true;
line.Values.Add(10);
line.XValues.Add(0);
line.Values.Add(20);
line.XValues.Add(0.1);
line.Values.Add(30);
line.XValues.Add(0.2);
|
|