By Charlie Penny - Thursday, October 22, 2020
Hello,
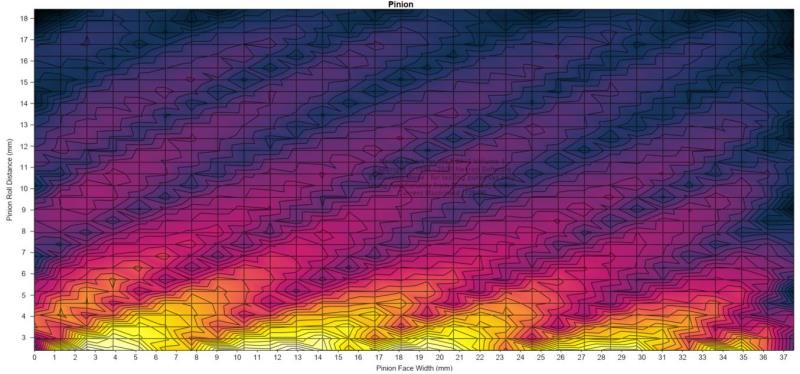
We are using an NMeshSurfaceSeries to plot the following data.
Due to the method used by Nevron to interpolate the data points we get the spikey features seen in the chart, across the diagonals of the grid.
We are aware of the CellTriangulationMode option which allows to pick the diagonal used for triangulation and in this case if the other diagonal is chosen we do get a better result.
However in general there is not easy way to pick the best diagonal to use.
Are there any other options/interpolation methods available which may give us a better results? E.g. a method independent of a triangulation where a weighted average of the grid values are used based on the distance to them?
|
By Nevron Support - Monday, October 26, 2020
Hi Charlie,
Currently, the supported options for the mesh surface triangulation are:
MaxDiagonal,
Diagonal1,
Diagonal2
so if you have a cell:
P11 P12
P21 P22
Diagonal 1 pick P11 P22 and Diagonal2 P21 P12. MaxDiagonal will pick P11 P22 or P12 P21 depending on which one has a bigger length. We can easily modify this to pick the minimum length as well or add other logic. Please send us a detailed overview of the diagonal picking logic that you have in mind for review.
|
|