By Joël Golinucci - Thursday, April 10, 2014
Hi again,
Sorry to spam the forum with this third topic in a row but I thought this might need to be ask in a separate topic.
How can I make my graph take the whole available space in the NChart object ? Chart is 3D, but for now only seen with an OrthogonalTop projection.
I need no axis or walls at all, but setting their visible property to false doesn't seems to be enough.
Here is the code I use to create the chartControl and the chart object.
Protected Sub CreateGraph()
    SyncLock fLockForChart
      ' Define the chart control (place holder for the graph)
      fChartControl = New NChartControl()
      fChartControl.Charts.Clear()
      fChartControl.Name = String.Format("chartControl_{0}", fSubPile.ToString())
      fChartControl.Dock = DockStyle.Fill
      fChartControl.Margin = New Padding(0)
      fChartControl.Padding = New Padding(0)
      fChartControl.BackgroundStyle.FrameStyle.Visible = False
      AddHandler fChartControl.Click, AddressOf Chart_Click
      AddHandler fChartControl.MouseDown, AddressOf Chart_MouseDown

      Dim zMin As Integer = fSubPile.Parent.DimMinZ.Value, zMax As Integer = Integer.Parse(fSubPile.Parent.DimMaxZ.Value) + Integer.Parse(fDataStorage.CellDimZ.Value)
      ' Define the graph and set its parameters
      fChart = New NCartesianChart()
      fChart.Series.Clear()
      fChart.Name = String.Format("nGraph_{0}", fSubPile.ToString())
      fChart.Enable3D = True
      fChart.Projection.SetPredefinedProjection(PredefinedProjection.OrthogonalTop)
      fChart.LightModel.SetPredefinedLightModel(PredefinedLightModel.None)
      fChart.BackgroundFillStyle = New NColorFillStyle(Color.LightBlue)                  ' For screenshot on Nevron Forum only
      fChart.Dock = DockStyle.Fill
      fChart.Location = New NPointL(0, 0)
      fChart.BoundsMode = BoundsMode.Stretch
      fChart.Padding = New NMarginsL(0)
      fChart.Margins = New NMarginsL(0)
      fChart.Height = zMax - zMin
      fChart.Axes(StandardAxis.PrimaryY).View = New NRangeAxisView(New NRange1DD(zMin, zMax))
      For Each wall As NChartWall In fChart.Walls
        'wall.Visible = False                                                           ' This is commentend to show the diffrence between screenshots
        wall.Width = 0
      Next
      'For Each axis As NCartesianAxis In fChart.Axes
      '  axis.Visible = False                                                           ' This is also commented only for the screenshot
      'Next

      ' Define the point series
      fRangeSeries = New NRangeSeries()
      fRangeSeries.Name = String.Format("nPointSeries_{0}", fSubPile.ToString())
      fRangeSeries.InflateMargins = False
      fRangeSeries.DataLabelStyle.Visible = False
      fRangeSeries.Legend.Mode = SeriesLegendMode.None
      fRangeSeries.BorderStyle.Width = New NLength(0)
      fRangeSeries.UseXValues = True
      fRangeSeries.UseZValues = True
      fRangeSeries.Shape = BarShape.Bar


      ' Add the serie to the graph, the graph to its place holder and the whole to the panel (subPileView)
      fChart.Series.Add(fRangeSeries)
      fChartControl.Charts.Add(fChart)
      Me.Controls.Add(fChartControl)
    End SyncLock
  End Sub
On the attached screenshot you will see that we are still able to see the blue background (with axis visible and not). What do I need to change to have the plot covering the blue area ?
Thanks for your help,
Best regards,
Joël
|
By Nevron Support - Thursday, April 10, 2014
Hi Joel,
The following code snippet shows how to create a chart that has the same aspect as the outer control:
' Define the chart control (place holder for the graph)
' Define the graph and set its parameters
NChartControl1.Panels.Clear()
Dim fChart As New NCartesianChart()
NChartControl1.Panels.Add(fChart)
fChart.Series.Clear()
fChart.Enable3D = True
fChart.Projection.SetPredefinedProjection(PredefinedProjection.OrthogonalTop)
fChart.LightModel.SetPredefinedLightModel(PredefinedLightModel.None)
fChart.BackgroundFillStyle = New NColorFillStyle(Color.LightBlue) ' For screenshot on Nevron Forum only
fChart.DockMode = PanelDockMode.Fill
fChart.Location = New NPointL(0, 0)
fChart.BoundsMode = BoundsMode.Fit
fChart.Padding = New NMarginsL(0)
fChart.Margins = New NMarginsL(0)
For Each wall As NChartWall In fChart.Walls
'wall.Visible = False ' This is commentend to show the diffrence between screenshots
wall.Width = 0
Next
Dim aspect As Double = NChartControl1.Width / NChartControl1.Height
fChart.Width = aspect * 50
fChart.Depth = 50
fChart.Axis(StandardAxis.Depth).ScaleConfigurator.Title.Text = "Depth"
For Each axis As NCartesianAxis In fChart.Axes
axis.Visible = False ' This is also commented only for the screenshot
Next
The effect is that it fills the whole chart control area. Let us know if you meet any problems or have any questions.
|
By Joël Golinucci - Friday, April 11, 2014
Hello,
Thanks for the answer, unfortunately this is not completely that, a bit better though but not perfect yet.
First this command is not correct:
fChart.DockMode = PanelDockMode.Fill
I had to replace it with this:
fChart.Dock = DockStyle.Fill
I understand that instead of placing the chart in the NChartControl1.Charts we put it in its Panels list, but I am have a few questions regarding the other changes :
1) Why are we using the value 50 in the chart width and depth ?
2) What is the point of naming the scale configurator title ? Especially if we are going to hide it after ?
Here is the modified code corresponding to the attached screenshot :
  ' Define the chart control (place holder for the graph)
  fChartControl = New NChartControl()
  fChartControl.Charts.Clear()
  fChartControl.Panels.Clear()
  fChartControl.Name = String.Format("chartControl_{0}", fSubPile.ToString())
  fChartControl.Dock = DockStyle.Fill
  fChartControl.Margin = New Padding(0)
  fChartControl.Padding = New Padding(0)
  fChartControl.BackgroundStyle.FrameStyle.Visible = False
  AddHandler fChartControl.Click, AddressOf Chart_Click
  AddHandler fChartControl.MouseDown, AddressOf Chart_MouseDown

  ' Define the graph and set its parameters
  fChart = New NCartesianChart()
  fChartControl.Panels.Add(fChart)
  fChart.Series.Clear()
  fChart.Enable3D = True
  fChart.Projection.SetPredefinedProjection(PredefinedProjection.OrthogonalTop)
  fChart.LightModel.SetPredefinedLightModel(PredefinedLightModel.None)
  fChart.BackgroundFillStyle = New NColorFillStyle(Color.Yellow)
  fChart.Dock = DockStyle.Fill                'There is no DockMode property in the NCartesianChart class. Incorrect code: fChart.DockMode = PanelDockMode.Fill
  fChart.Location = New NPointL(0, 0)
  fChart.BoundsMode = BoundsMode.Fit
  fChart.Padding = New NMarginsL(0)
  fChart.Margins = New NMarginsL(0)
  For Each wall As NChartWall In fChart.Walls
   wall.Visible = False
   wall.Width = 0
  Next
  Dim aspect As Double = fChartControl.Width / fChartControl.Height
  fChart.Width = aspect * 50
  fChart.Depth = 50
  fChart.Axis(StandardAxis.Depth).ScaleConfigurator.Title.Text = "Depth"
  For Each axis As NCartesianAxis In fChart.Axes
   axis.Visible = False
  Next

|
By Nevron Support - Monday, April 14, 2014
Hi Joel,
1. I had to replace it with this:
fChart.Dock = DockStyle.Fill
Sorry for this - the upcoming 2014.1 release has renamed this property in order to avoid using System.Windows.Forms enums in chart DOM.
2) Why are we using the value 50 in the chart width and depth ?
It can be any value however it's good to keep the chart model bounds in the range 20-100 in order for them to be in the viewing frustrum. The model values hare are just used to define an aspect.
3) What is the point of naming the scale configurator title ? Especially if we are going to hide it after ?
That should be removed from the code as it is not required.
Hope this helps - let us know if you meet any problems.
|
By Joël Golinucci - Tuesday, April 15, 2014
Hi,
Yes you have answered all my questions but one: as you can see in the previous screenshot the chart is not taking perfectly the whole space available and there is still some unwanted "borders" around each graph. Altought it is more like the chart is not taking the complete space of the placeholder because the back color we see is the one set for the chart control.
|
By Joël Golinucci - Tuesday, April 29, 2014
Hello again,
Have you managed to find something about this issue ?
My graphs are still not using the full available space and I think I've tested everything I could on my own.
Help will be appreciated.
Best regards,
Joël
|
By Nevron Support - Tuesday, April 29, 2014
Hi Joel,
Can you post a small project to our support replicating this problem - it can be a number of things like padding, margins, pixel rounding etc...
|
By Joël Golinucci - Thursday, July 10, 2014
Hello,
Sorry to continue this thread only 3 months later (I was stuck on other parts of the project, but I finally managed to find some time to create this demo project).
You will find a very simplified use of the classes needed for the graph display, where the data is hard coded.
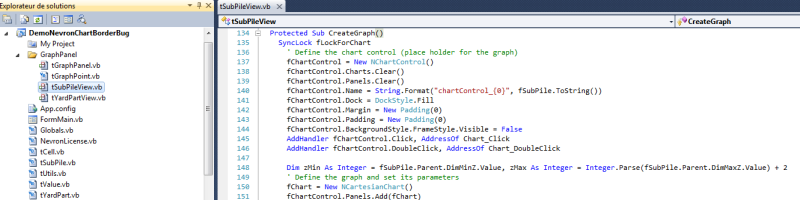
All the usefull code for graphs can be found in DemoNevronChartBorderBug\GrpahPanel\tSubpileView.vb. More specifically in the CreateGraph() sub for the graph creation, and on the UpdateGraphThreadPayload() sub for the data (rangeSeries) update.
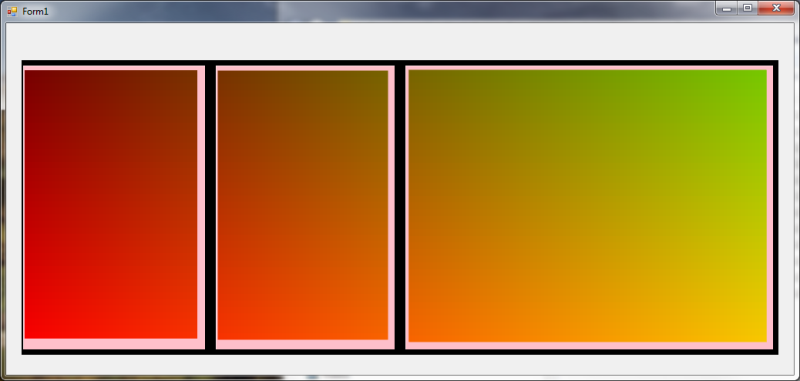
To sum up the question: How can I get rid of these pink borders ?
I would like to have the NRangeSeries fit the NChart object, itself filling the NChartControl completely.
Many thanks for your help !
Best regards,
Joël Golinucci
|
By Nevron Support - Thursday, July 10, 2014
Hi Joel,
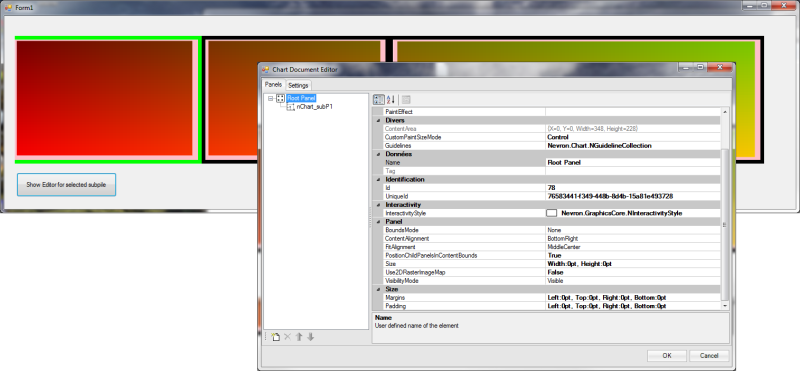
Please post a more easy to comprehend example - it is hard for us to find where the chart control is actually located. For example place a button on the form and execute:
someChartControl.ShowEditor()
This will make it easier for us to inspect the actual chart state.
|
By Joël Golinucci - Thursday, July 10, 2014
Hi,
Here's a modified version of the project with a button to ShowEditor() as requested. :
You can find the project zip here : DemoNevronChartBorderBug.zip
You don't need to worry about the other classes, only look within tSubpileView.vb. The nevron objects are created in the CreateGraph() sub and the data (NRangeSerie) are added in UpdateGraphThreadPayload() on the same file.
|
By Joël Golinucci - Tuesday, July 15, 2014
Dear support team,
Have you been able to find something from the given demo project ?
Are you experiencing the same strange results as I do ?
Thanks for your feedback.
Joël
|
By Nevron Support - Wednesday, July 16, 2014
Hi Joel,
You probably forgot to attach the project...
|
By Joël Golinucci - Thursday, July 17, 2014
Did you have any issue downloading it ?
I've tried to add it directly to the post but the forum doesn't allow me to (file too big).
Also the message "an attachment is uploading..." stays after the message
Anyway, please let me know directly if you have any issue downloading the file from http://www.onlineautomation.ch/jgolinuc/forum/DemoNevronChartBorderBug.zip
|
By Nevron Support - Monday, July 21, 2014
Hi Joel,
We just reviewed the project again - why do you have to use the range series for a chart that is essentially 2D? In 2D mode it is much easier to set the chart bounds so that that they fill the area completely:
NChart chart = nChartControl1.Charts[0]; chart.BoundsMode = BoundsMode.Stretch;
chart.DockMode = PanelDockMode.Fill; chart.Axis(StandardAxis.PrimaryX).Visible = false;
chart.Axis(StandardAxis.PrimaryY).Visible = false; chart.Wall(ChartWallType.Back).FillStyle = new NColorFillStyle(Color.Green); Hope this helps - let us know if you meet any problems or have any questions.
|
|