By Joël Golinucci - Thursday, November 27, 2014
Hi,
I'm using a triangulated surface to represent a stock of raw material with diffrent heights with data coming from a database. In this database, the stock is splitted into cells with the coordinates of the center and the 2D cell size, then, for each cells I have a value of height and a product type.
When I plot these data into a triangulated surface by giving only the coordinates of the center of the cell and the height it displays some sort of pyramidal shapes like this:
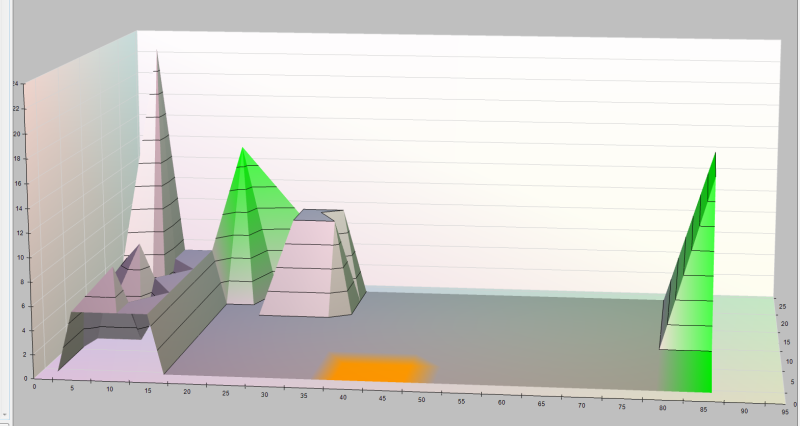
I would like to be able to display the correct cell sizes, typically the green pyramidal on the left-back is in fact a silo so the material inside is not in shape of a pyramid and should not finish in a single point but in a square.
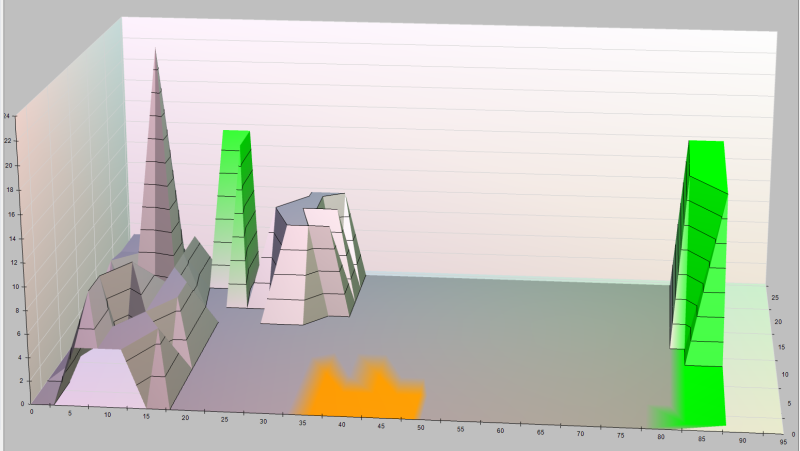
I tried, instead of plotting one point per cell, to add 4 point per cell (the 4 angles calculated from the center coordinate and the cell dimension) but here's what is displayed:
This is the code I used for the one-point-per-cell graph:
For i As Integer = 0 To pCells.Count - 1
Dim x As Integer = (pCells(i).Position.X - minX) / scaleFactor
Dim y As Integer = (pCells(i).Position.Y - minY) / scaleFactor
Dim z As Double = (pCells(i).Height - minZ) / scaleFactor
FSurfaceSeries.XValues.Add(x)
FSurfaceSeries.ZValues.Add(y)
FSurfaceSeries.Values.Add(z)
FSurfaceSeries.Colors.Add(GetColorByProduct(pCells(i).Produit))
Next
And the same but for four-points-per-cell graph:
For i As Integer = 0 To pCells.Count - 1
Dim x1 As Integer = (pCells(i).Position.X - pCells(i).Dimension.Width / 2 - minX) / scaleFactor
Dim x2 As Integer = (pCells(i).Position.X + pCells(i).Dimension.Width / 2 - minX) / scaleFactor
Dim y1 As Integer = (pCells(i).Position.Y - pCells(i).Dimension.Height / 2 - minY) / scaleFactor
Dim y2 As Integer = (pCells(i).Position.Y + pCells(i).Dimension.Height / 2 - minY) / scaleFactor
Dim z As Double = (pCells(i).Height - minZ) / scaleFactor
'Top-left
FSurfaceSeries.XValues.Add(x1)
FSurfaceSeries.ZValues.Add(y1)
FSurfaceSeries.Values.Add(z)
FSurfaceSeries.Colors.Add(GetColorByProduct(pCells(i).Produit))
'Top-right
FSurfaceSeries.XValues.Add(x2)
FSurfaceSeries.ZValues.Add(y1)
FSurfaceSeries.Values.Add(z)
FSurfaceSeries.Colors.Add(GetColorByProduct(pCells(i).Produit))
'Bottom-right
FSurfaceSeries.XValues.Add(x2)
FSurfaceSeries.ZValues.Add(y2)
FSurfaceSeries.Values.Add(z)
FSurfaceSeries.Colors.Add(GetColorByProduct(pCells(i).Produit))
'Bottom-left
FSurfaceSeries.XValues.Add(x1)
FSurfaceSeries.ZValues.Add(y2)
FSurfaceSeries.Values.Add(z)
FSurfaceSeries.Colors.Add(GetColorByProduct(pCells(i).Produit))
Next
Please note that for me the 2D base (or projection) is having X-Y coordinates and the elevation(or height) is in the 3rd coordinate Z, that's why I'm adding coord y to the Zvalues and coord Z to the values.
Thank you for your help,
Best regards,
Joël
|
By Nevron Support - Monday, December 1, 2014
Hi Joel,
If you wan to create a grid of bars then you can take a look at the All Examples\Real Time\Real Time Bar example. Most likely it does what you want to achieve...
|
By Joël Golinucci - Tuesday, December 2, 2014
Hi,
Thanks for the suggestion but where can I found this "all example\Real time\Real time bar" example?
I've looked here: http://examplesaspnetchart.nevron.com/ and in the examples installed with Nevron Charts and I couldn't find it.
The installed example about form says I have version 13.8.30.12, should I get an update?
Regards,
Joël
|
By Nevron Support - Tuesday, December 2, 2014
Hi Joel,
Yes - it is distributed as part of the 2014 release. The main goal of the example is to demonstrate performance in desktop application, but it also shows how to configure a grid of bars...
|
By Joël Golinucci - Wednesday, December 3, 2014
Hi,
I've downloaded and installed the 2014 version and had very few changes to do in the rest of my code for the program to run which is nice. I've tried the example you suggested (Real time bars) and it really looks great so I will try to use it. But just a few question:
- will I be able to use a custom color for each bar? (The color will represent the type of product and depends on the X-Z coordinates and not the elevation)
- will I be able to update any point on the grid (changing only the elevation for a given X-Z coordinate) because in the example it seems that each new point is added on the right and it makes a point dissapear on the left.
- if all this is OK, what should I do with my license for 2012 Nevron? How can it be upgraded and at which cost?
Here are my 2012 licensing details:
Version Id [v2012Vol1]
Key Type [Design]
Machine Id [54215]
Product Type [NetVision]
Edition Type [Enterprise]
Thanks for your help,
Best regards,
Joël
|
By Nevron Support - Wednesday, December 3, 2014
Hi Joel,
- will I be able to use a custom color for each bar? (The color will represent the type of product and depends on the X-Z coordinates and not the elevation)
Yes - the example shows how to assign custom color per bar.
- will I be able to update any point on the grid (changing only the elevation for a given X-Z coordinate) because in the example it seems that each new point is added on the right and it makes a point disappear on the left.
Yes - this is an example of some imaginary real time bar - you can of course create a static grid by simply using several bar series.
- if all this is OK, what should I do with my license for 2012 Nevron? How can it be upgraded and at which cost?
you need to contact sales@nevron.com for details about upgrade pricing in case you decide to upgrade.
Hope this helps - let us know if you meet any problems or have any questions.
|
By Joël Golinucci - Wednesday, December 10, 2014
Hi,
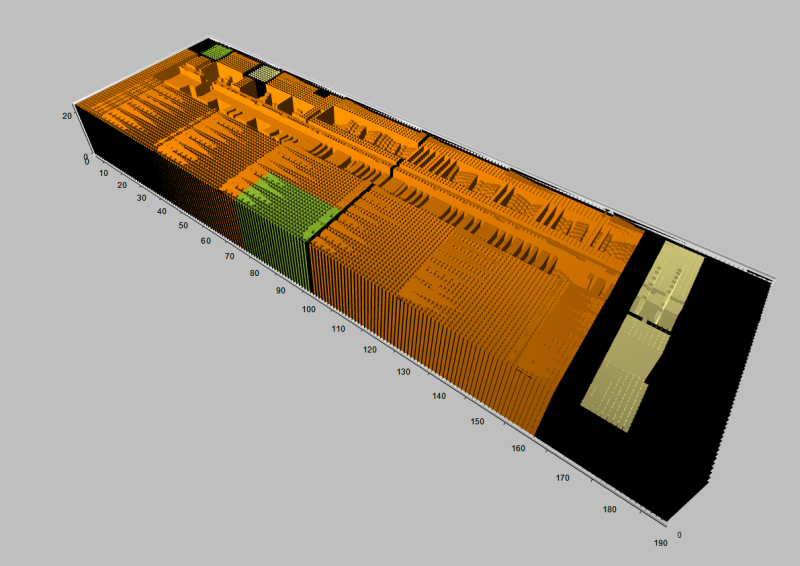
I've tried to use the real time bar graph example in Nevron Charts 2014 and it's going in the right direction, except that it seems that I have a rendering problem with some sort of flickering on the chart. Also it seems like the borders of the bar graph are drown even though I specified boderstyle.width = 0 as in the example.
Here is the graph with a Bitmap rendering:
And the same with rendering to Window:
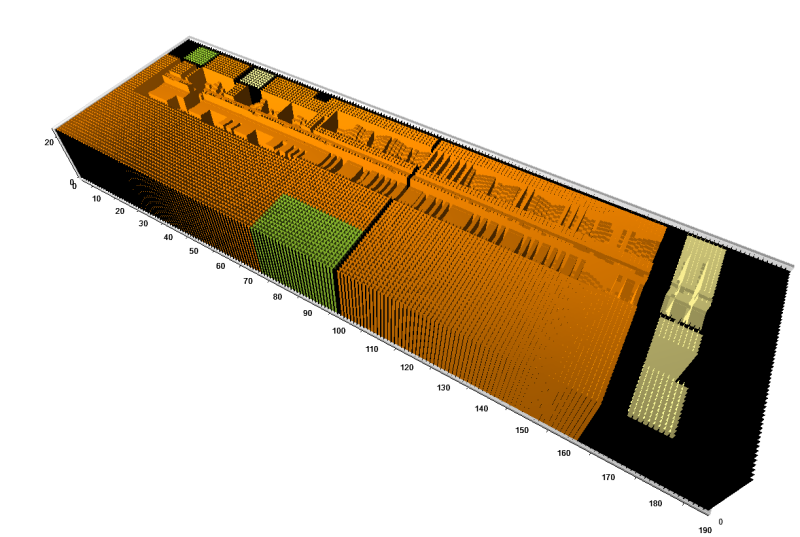
They look a bit different but both are not smooth looking.
Here's how I create the ChartControl:
Protected Function MakeChartControl() As NChartControl
Dim result As New NChartControl
result.Charts.Clear()
result.Panels.Clear()
result.Dock = DockStyle.Fill
result.Margin = New Padding(0)
result.Padding = New Padding(0)
result.BackgroundStyle.FrameStyle.Visible = False
'I've tried to play with these 3 settings here but nothing really changes
result.Settings.JitterMode = JitterMode.Auto
result.Settings.RenderSurface = RenderSurface.Window
result.Settings.ShapeRenderingMode = ShapeRenderingMode.AntiAlias
result.AutoRefresh = False
Return result
End Function
And here I create the NChart:
Protected Function AddChartToChartControl(TheChartControl As NChartControl) As NChart
Dim result As New NCartesianChart()
result = New NCartesianChart()
TheChartControl.Charts.Add(result)
result.Series.Clear()
result.Enable3D = True
result.Fit3DAxisContent = False
result.Name = "Main stock chart"
result.Projection.SetPredefinedProjection(PredefinedProjection.Perspective2)
result.LightModel.SetPredefinedLightModel(PredefinedLightModel.GlitterRight)
result.BackgroundFillStyle = New NColorFillStyle(Color.Silver)
result.Dock = DockStyle.Fill
result.BoundsMode = BoundsMode.Fit
result.Padding = New NMarginsL(50)
result.Margins = New NMarginsL(0)
result.Height = 20
result.Width = GetGridSizeX()
result.Depth = GetGridSizeY()
result.Axis(StandardAxis.PrimaryX).View = New NRangeAxisView(New NRange1DD(FMinX, FMaxX))
result.Axis(StandardAxis.Depth).View = New NRangeAxisView(New NRange1DD(FMinY, FMaxY))
result.Axis(StandardAxis.PrimaryY).View = New NRangeAxisView(New NRange1DD(FMinZ, FMaxZ))
result.Axis(StandardAxis.Depth).ScaleConfigurator.Invert = Not FDisplayB2T
result.Axis(StandardAxis.PrimaryX).ScaleConfigurator.Invert = FDisplayR2L
For Each wall As NChartWall In result.Walls
wall.VisibilityMode = WallVisibilityMode.Auto
Next
Return result
End Function
Finally, the bar series are created in the same way as in the example:
Protected Function AddSurfaceSeries(ByRef TheChart As NChart) As List(Of NBarSeries)
Dim result As New List(Of NBarSeries)
Dim gridSizeX As Integer = GetGridSizeX()
Dim gridSizeY As Integer = GetGridSizeY()
'Create the NBarSeries
TheChart.Series.Clear()
FMatrix = New Double(gridSizeY - 1)() {}
For y As Double = 0 To gridSizeY - 1 Step FYGridSize
'Create a new line in the matrix
FMatrix(y) = New Double(gridSizeX - 1) {}
Dim bar As New NBarSeries()
result.Add(bar)
TheChart.Series.Add(bar)
bar.WidthPercent = 100.0F
bar.DepthPercent = 100.0F
'bar.EnableDepthSort = False 'Does not exists in Nevron v13.8.30.12
bar.DataLabelStyle.Visible = False
bar.Values.ValueFormatter = New Nevron.Dom.NNumericValueFormatter("0.0")
bar.Values.EmptyDataPoints.ValueMode = EmptyDataPointsValueMode.Skip
bar.Values.Clear()
'Does not exists in Nevron v13.8.30.12:
'bar.FillStyles.StorageType = IndexedStorageType.Array
'bar.DataPointOriginIndex = 0
' turn off bar border to improve performance
bar.BorderStyle.Width = New NLength(0)
Next
Return result
End Function
Thank you for your time and help,
Best regards,
Joël
|
By Nevron Support - Thursday, December 11, 2014
Hi Joel,
We're not quite sure what's going wrong (and even what the intended result is). Please consider posting a support ticket with more information.
|
|