By Jerry Jacob - Thursday, January 29, 2015
Is there a way to change the labelmode based on the data?
Something along the lines of
if (pieSeries.Values[i] > .1){
        //I want to change the labelMode of this value to Center on the pie chart
        pieSeries.LabelMode = PieLabelMode.Center;
        }else {
        //I want to change the labelMode of this value to SpiderNoOverlap on the pie chart
        pieSeries.LabelMode = PieLabelMode.SpiderNoOverlap;
        }
Also how can I adjust the lengths of the lines for SpiderNoOverlap. I tried the following without success.
pieSeries.DataLabelStyle.ArrowLength = new NLength(1.0f,NRelativeUnit.ParentPercentage);
pieSeries.DataLabelStyle.ArrowPointerLength = new NLength(1.0f,NRelativeUnit.ParentPercentage);
|
By Nevron Support - Friday, January 30, 2015
Hi Jerry,
You can control the length of the connectors using the LeadOffArrowLength and ConnectorLength properties of the pie series (the lines that connect pie sectors with their data labels consist of several parts). As for the labels - all labels in the pie use the same style so there is no way to mix them. Hope this helps let us know if you meet any problems or have any questions.
|
By Jerry Jacob - Friday, January 30, 2015
I have tried
pieSeries.LabelMode = PieLabelMode.SpiderNoOverlap;
pieSeries.LeadOffArrowLength = new NLength(0.25f);
pieSeries.ConnectorLength = new NLength(0.25f);
And changed the length to be different numbers but I haven't noticed any change in the size of the line.
|
By Nevron Support - Tuesday, February 3, 2015
Hi Jerry,
Probably you started experimenting with zero value - that's why you don't see a difference - try to insert larger values - like 10, 12, 15... etc.
|
By Jerry Jacob - Wednesday, February 4, 2015
I tried different ranges of numbers, however for my current situation I am trying to make the lines smaller which does not seem to be working.
The problem stems from not being able to switch the Label mode, because if I use center, there are some pie pieces that are too small for the text, and if i use spider then the chart shrinks to allow the words to appear on the side and then the chart is too small.
Do you have any suggestions on how to try to get around this so that it can work out? I was considering trying to make a whole new pie series for each piece so that way theoretically they would have independent labelmodes. Would that work? If so, what would be the best way to do that. I figured if there was a way to get the percentage of each block, then basically transform each pie piece to its own series with that percentage as the max for the pie and let it consume the whole thing.
|
By Nevron Support - Friday, February 6, 2015
Hi Jerry,
One solution would be to use anchor panels for the labels that you wish to exclude from automatic layout. The following code snippet shows how to achieve this:
nChartControl1.Panels.Clear(); NPieChart pieChart = new NPieChart(); nChartControl1.Panels.Add(pieChart); NPieSeries pieSeries = new NPieSeries();
pieChart.Series.Add(pieSeries); pieSeries.Values.Add(10);
pieSeries.Values.Add(10);
pieSeries.Values.Add(10);
pieSeries.LabelMode = PieLabelMode.SpiderNoOverlap; pieSeries.Labels.Add("One");
pieSeries.Labels.Add("");
NDataLabelStyle dls = new NDataLabelStyle();
dls.Visible = false;
pieSeries.DataLabelStyles[1] = dls;
pieSeries.Labels.Add("Three"); NLabel label = new NLabel("Two");
label.ContentAlignment = ContentAlignment.MiddleCenter;
label.TextStyle = (NTextStyle)dls.TextStyle.Clone();
NAnchorPanel anchorPanel = new NAnchorPanel();
anchorPanel.ChildPanels.Add(label);
anchorPanel.Anchor = new NPieDataPointAnchor(pieSeries, 1, 1, StringAlignment.Center); nChartControl1.Panels.Add(anchorPanel); Hope this helps - let us know if you meet any problems or have any questions.
|
By Jerry Jacob - Friday, February 6, 2015
This may be a silly question but how do I get a NChartControl in to the chart? I can't seem to find it.
Thanks!
|
By Nevron Support - Monday, February 9, 2015
Hi Jerry,
The NChartControl instance (nChartControl) is automatically created by the designer when you drop the control on the form. Your control can have a different name of course... Let us know if you meet any problems.
|
By Jerry Jacob - Monday, February 9, 2015
Where would I find the name though? Under properties I see NChart1, but when I try using it I get an error
Compiling...
(25,13) : error CS0103: The name 'NChart1' does not exist in the current context
Compiled with 1 error(s).
Not sure if its because of how I have the code set up referencing context in the RSMain, but not sure how to adjust it to do what we are trying.
I pasted the code below in case it will help in solving this. I really appreciate your efforts on this.
Thanks,
using System;
using System.Drawing;
using Nevron.GraphicsCore;
using Nevron.Chart;
using Nevron.ReportingServices;
using System.Text.RegularExpressions;
namespace MyNamespace
{
public class MyClass
{
public static void RSMain(NRSChartCodeContext context)
{
if (context.document.Charts.Count == 0)
return;
NChart1.Panels.Clear();
NPieChart pieChart = context.document.Charts[0] as NPieChart;
if (pieChart == null)
return;
NPieSeries pieSeries = pieChart.Series[0] as NPieSeries;
int dpCount = pieSeries.Values.Count / 2;
int backColorOffset = dpCount;
for (int i = 0; i < dpCount; i++)
{
string strColors = (string)pieSeries.Labels[backColorOffset+i];
if (strColors == "") {
strColors = "0,0,0";
}
char[] delimiterChars = {','};
string[] intColors = strColors.Split(delimiterChars);
int[] convertedItems = Array.ConvertAll<string, int>(intColors, int.Parse);
Color pieColor = Color.FromArgb(convertedItems[0],convertedItems[1],convertedItems[2]);
Color pieColor_White = Color.FromArgb(255,255,255);
pieSeries.FillStyles[i] = new NColorFillStyle(pieColor);
pieSeries.BorderStyles[i] = new NStrokeStyle(.1f, pieColor_White);
pieSeries.DataLabelStyle.ArrowStrokeStyle = new NStrokeStyle(pieColor);
}
// clean up the chart
for (int i = pieSeries.Values.Count - 1; i >= dpCount; i--)
{
pieSeries.RemoveDataPointAt(i);
}
}
}
}
|
By Nevron Support - Tuesday, February 10, 2015
Hi Jerrry,
This obviously relates to SSRS - in this case you simply need to use the context.Document, instead of nChartControl and you'll be OK - for example:
context.document.RootPanel.ChildPanels.Clear();
However in your case we think that you should not clear the panels collection - the pie chart is already created and configured - you just need to alter some label settings so the code should simply omit the Clear line of code:
NChart1.Panels.Clear();
Hope this helps - let us know if you meet any problems or have any questions.
|
By Jerry Jacob - Tuesday, February 10, 2015
That was a big help. Sorry for posting this in the wrong sub-forum.
There is one last piece that I am trying to work through. The LabelMode - If I use rim or Spider there are times when text overlaps, but when I use SpiderNoOverlap the arrows are so long that it shrinks the entire chart. Is there a way so that the labels don't overlap but use the minimum space necessary with the arrow?
|
By Nevron Support - Wednesday, February 11, 2015
Hi Jerry,
You can try to diminish the LeadOffArrowLength and ConnectorLength properties - for example:
pieSeries.LeadOffArrowLength = new NLength(0);
pieSeries.ConnectorLength = new NLength(0);
|
By Jerry Jacob - Wednesday, February 11, 2015
I tried that but when it is in SpiderNoOverlap it doesn't seem to use that property at all. It just auto places the labels shrinking the chart. Whether i set it to 0 or 50 it doesn't affect it. If I change to Rim those properties seem to get used, but when I tried it under certain conditions the text overlaps. The Ideal situation is something that would be like Rim No Overlap.
|
By Nevron Support - Thursday, February 12, 2015
Hi Jerry,
Unfortunately the control currently does not support non overlapping labels resolve when in Rim mode.
|
By Jerry Jacob - Thursday, February 12, 2015
I understand that, I was wondering if there was a suggested alternative. Something that lets me adjust the length of the arrows while maintaining spiderNoOverlap. Something to the degree of not forcing all the labels to align on the right or left side.
Using spiderNoOverlap, even when hiding a most of the labels and using the anchor to put them inside the pie chart, what ends up happening is the arrows extend to the point as if those "hidden" labels are still there so as to align with them. 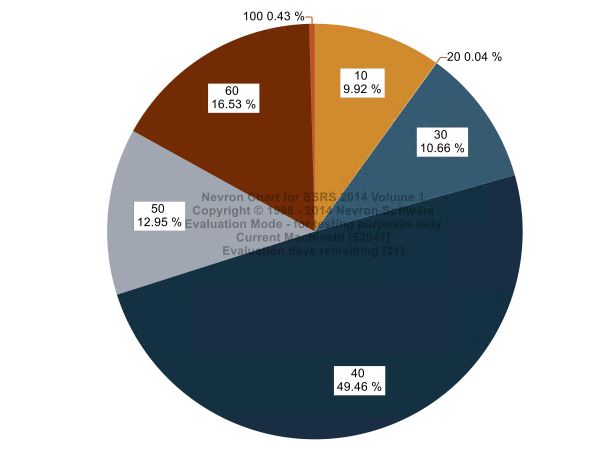
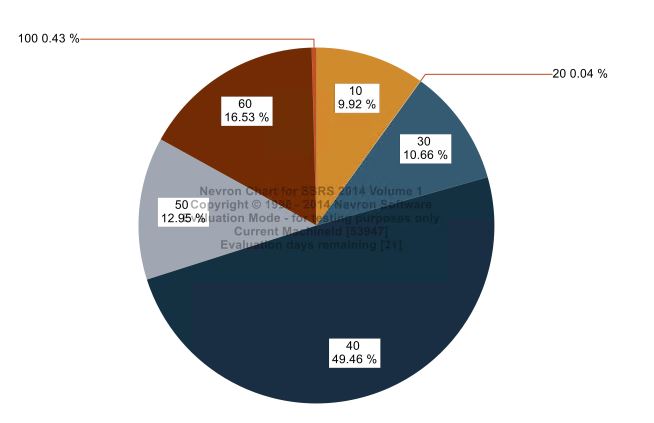
You can see the size difference, and it isn't so much the size difference as the wasted space that the line is taking up unnecessarily in the SpiderNoOverlap. I believe its because it is trying to align the labels that are hidden also as seen below.
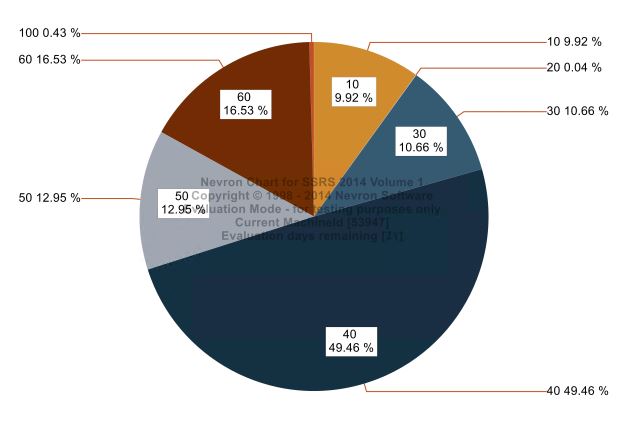
Is there any suggestions to help shrink those lines while preserving no Overlap?
|
By Jerry Jacob - Friday, February 13, 2015
The problem comes when the pie looks like this.
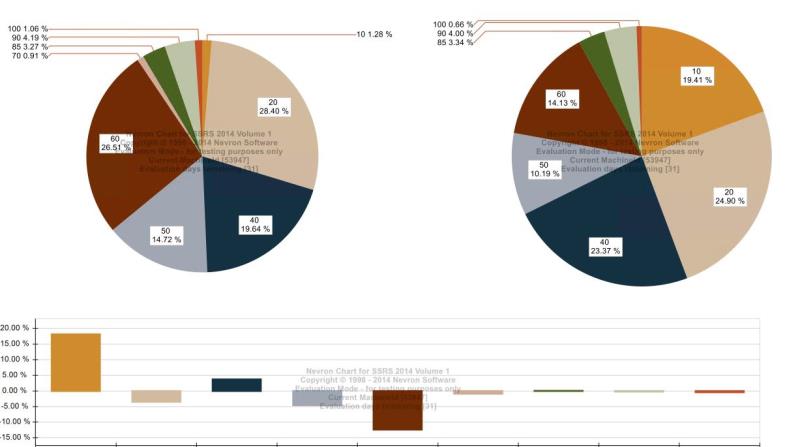
Where 2 exactly same sized charts show up differently because the labeling. Ideally we would want both of these pies that are placed as subreports in another report to show up identically sized. where as right now in one the label dominates more space and shrinks the pie chart. Any suggestions would be greatly appreciated. Thanks!
|
By Nevron Support - Monday, February 16, 2015
Hi Jerry,
Unfortunately currently there is no way to force the control to achieve this - unless there is an option like rim no overlap where the labels don't push the pie chart inside. We'll consider adding such an option in the control, but this can take a while...
|
|