By christopher de coster - Wednesday, May 6, 2015
Hi,
I can't seem to plot all my values.
Disabled cluster mode.
Is there another setting/property that limits the number of points?
Regards,
C
|
By Nevron Support - Wednesday, May 6, 2015
Can you provide additional details regarding your problem?
|
By christopher de coster - Wednesday, May 6, 2015
My dataset returns almost 2000 rows.
A Microsoft scatter chart plots all those 2000 values.
The Nevron XY scatterchart just plots 30?
Chart Area: Sub Type: XY Scatter
Cluster Mode: Disabled
1 Value field: Y= Fields!Measure.Value, X= Fileds.Age.Value
1 Category field: Group By: Fields!Age.Value
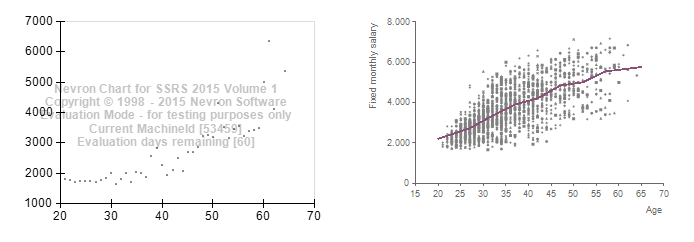
See screenshot below, both charts side by side and based on the same dataset. Right is default SSRS scatter chart.
|
By Nevron Support - Wednesday, May 6, 2015
It looks like you are missing something in the configuration of the XY scatter chart.
Can you please send us your sample data (in Excel spreadsheet) and possibly the current RDL for review?
|
By christopher de coster - Thursday, May 7, 2015
Hi Support Team,
Please find attached a zipped .RDL file.
I scripted the data to be inserted in a table variable, so no need to import CSV.
I suspect indeed a configuration issue.
Thanx in advance.
Tips on adding a trendline are welcome as well :-)
Chriz
|
By Nevron Support - Thursday, May 7, 2015
Hi Chriz,
What you are missing in the Nevron Chart (compared to the ms chart) is the Series grouping:
=Fields!Measure.Value
Also, in order to replicate the ms chart and add the "Trend" series, you need to switch the chart to Combo -> XY Scatter
Your first series should be Point and the second one Line.
You can review the modified RDL and let us know if you have any questions.
|
By christopher de coster - Tuesday, May 12, 2015
This is indeed the solution.
Not very straightforward though. One would expect that series are used to contain groups in the dataset, nevermind.
But performance wise it is not an improvement.
Average response from the SSRS component is 1,5 seconds, your Nevron component takes about 22 seconds.
Can we speed this up?
|
By Nevron Support - Wednesday, May 13, 2015
Hi Chriz,
There are a number of properties that you can use to fine-tune the performance of the control.
You can also turn on Statistics in order to review what takes most time. Our test shows about 2 seconds in total.
Please, take a look at the updated RDL sample and let us know if you have any questions.
|
|