By Marco Cernuschi - Monday, September 21, 2015
Hi
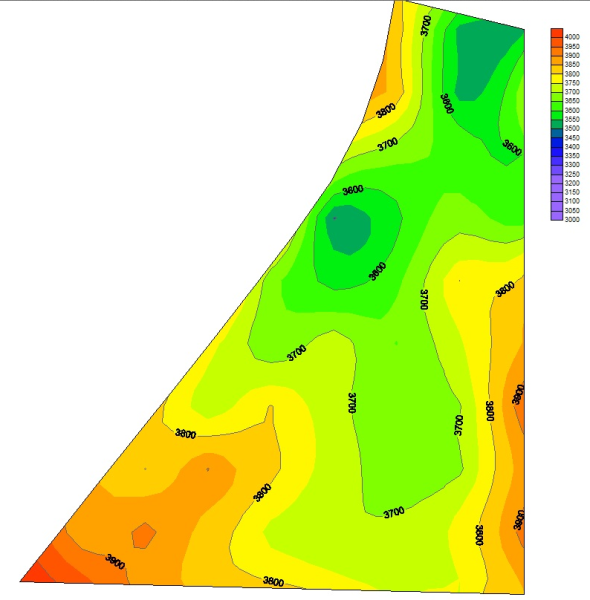
My company is developing a c# software to analyze material density information. At the end of the math we need to show the results as an heatmap chart with contour lines.
We would like to show the values on the contour lines (see example below). Can we do it using the Nevron Chart libraries?
|
By Nevron Support - Monday, September 28, 2015
Hi Marco,
You can take a look at the following examples shipped with the control that show how to create a heat map chart:
All Examples \ Chart Gallery \ Heat Map
heat map in 2D with support for empty data points, but no contour lines. We also have plans to have an annotated contour support in the next major release.
All Examples \ Chart Gallery \ Grid Surface
All Examples \ Chart Gallery \ Mesh Surface
All Examples \ Chart Gallery \ Triangulated Surface
All these series types can be used to display heat map with contour (you need to just modify the chart projection so that it looks at the chart from top to bottom). It also depends on how the incoming data is organized. Most likely based on the image you attached you will require a mesh or triangulated series.
Hope this helps - let us know if you meet any problems or have any questions.
|
|