By Guy Gallant - Wednesday, September 30, 2015
Hi ,
I have made a graph that displays up to 17 data points. I would like to assign a different shape for some of those
data points. So far I know how to change the shapes for ALL the data poins.
Is it possible to have data points that are made up of different shapes.
Thanks
Guy Gallant
|
By Nevron Support - Thursday, October 1, 2015
Hi,
One solution is to have several point series - one for each distinct type of point. Then through the Value expression of each point series you can assign a Nothing value to the data points that should be hidden and a valid value for those that need to be visible. This will result in a chart with different point shapes.
|
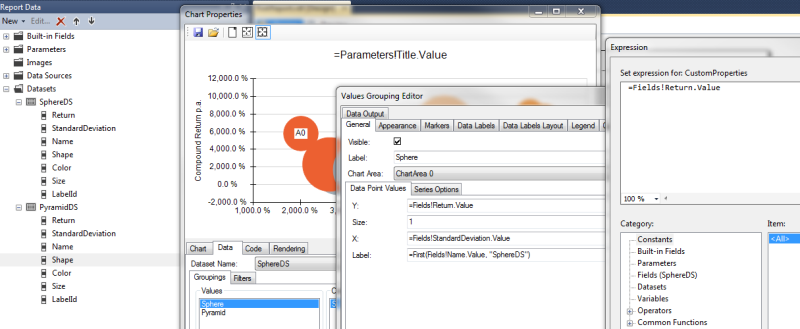
By Guy Gallant - Thursday, October 1, 2015
I have not been able to Assign a 2nd dataset to the 2nd data Grouping. When I create a 2nd Grouping it only sees fields for
the first DataSet. The enclosed image shows what is available for the 1st data series .
I have her types of charting/reportwriters and creating/using a 2nd dataset is relatively easy.
An alternative could be one dataset but with a filtered applied at the grouping .However even this approach seems to have its problems.
Are there any examples that clearly shows the creation of more then 1 data point serie?
|
|