By Greg Corliss - Thursday, October 22, 2015
I am attempting to make a Pie Chart from a simple list of employee Types. We have two employee types (called Line Type) and I just want to count each type and show it in a pie chart. Seems like it would be simple but can't get it to work.
Below is my setup. The Data is coming from a list, the Line Type has Civilian employees and Contract Employees as two different types spread out over 160 or so different employees. It's a List Text Field.
The chart displays absolutely nothing. Just a White screen.
My thought was just Count that line type. It appears my logic is flawed. This is how I have it set up:
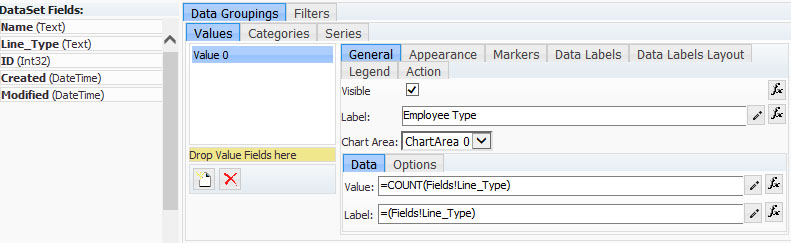
Any help would be greatly appreciated.
|
By Nevron Support - Thursday, October 22, 2015
Hello Greg,
You probably don't have a Category for your pie chart.
The following KB topic shows how you can count the number of items for the column in your SP list: http://support.nevron.com/KB/a166/count-number-items-a-column-using-sharepoint-chart-pivot.aspx
Hopefully this helps.
|
By Greg Corliss - Thursday, October 22, 2015
That was it. Left the category out. Thanks for the quick response!
|
|