By Kevin Harrison 1 - Thursday, October 29, 2015
We have been setting the bar widths using bar.WidthPercent = 80 for years now, and we have many tests which compare generated images with expected results.
I am evaluating 15.10.28.12 and finding that all my tests generating charts containing bars are failing because the generated bars are much narrower in the latest release. The total width of the bars is much less than the 80% I have asked for.
Please can you fix this bug asap.
Thanks
Kevin
|
By Nevron Support - Monday, November 2, 2015
Hi Kevin,
We just tested with the same version and it did not have any problems - can you post a screenshot with code for the different behavior?
|
By Kevin Harrison 1 - Monday, November 2, 2015
 vs vs 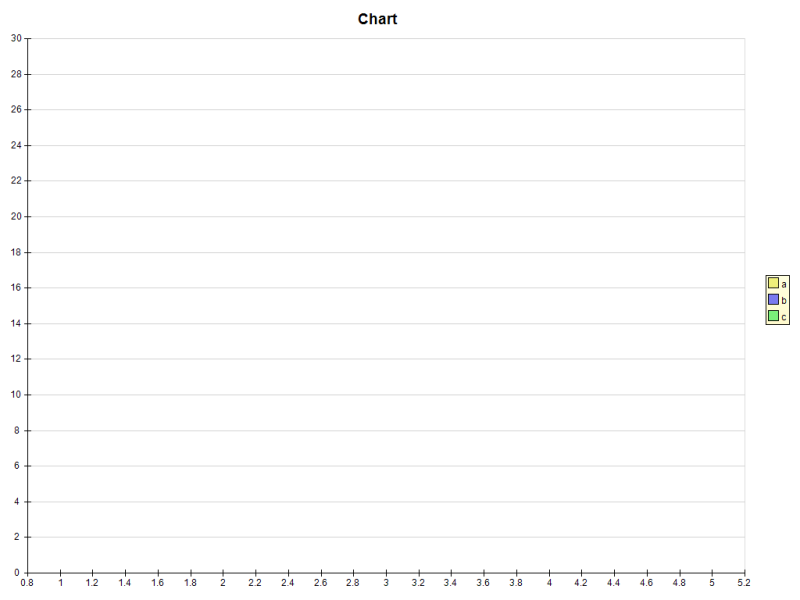
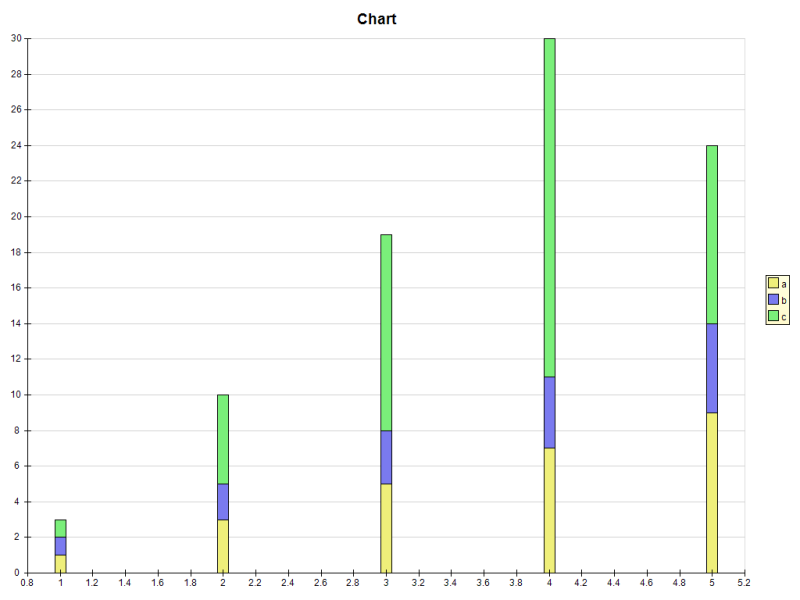
Single bar example - where's the bar gone?
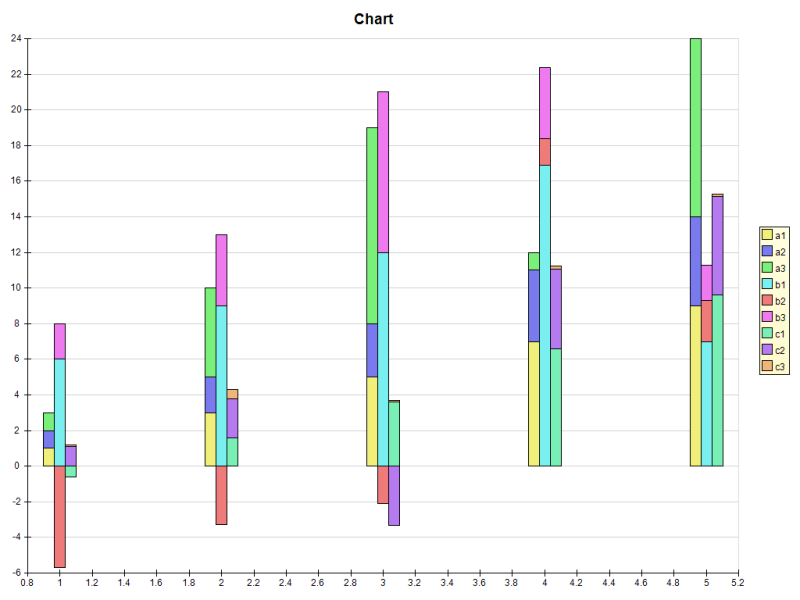 vs vs 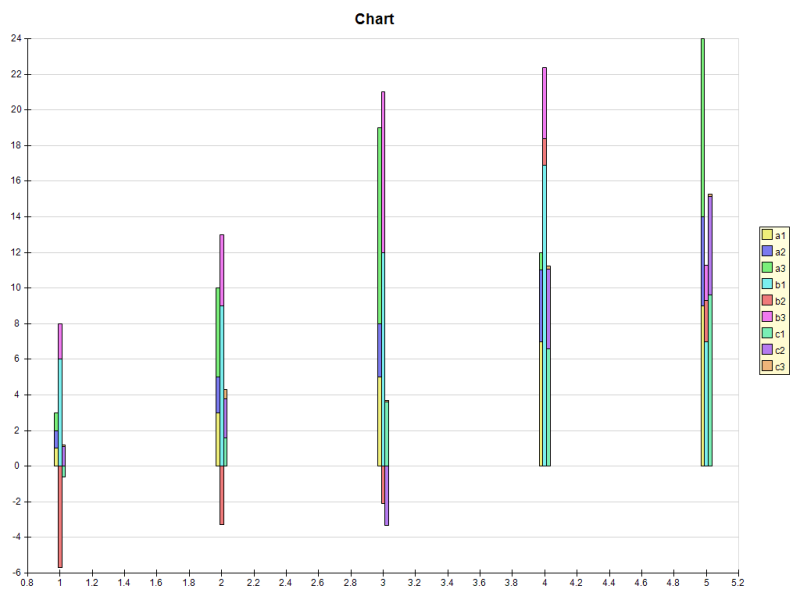
Multiple bar example - all bars much thinner.
Both charts are using x values.
|
By Kevin Harrison 1 - Tuesday, November 3, 2015
Apologies, the code line I gave is for categorical x axes, whereas the failing charts all have x-values supplied, so the code line behaving differently is:
bar.BarWidth = new NLength(1.5f, NRelativeUnit.ParentPercentage);
Does this now enable you to find out where the problem is?
I don't know if it's related but the size of symbols on line plots, which also use NRelativeUnit.ParentPercentage, are also slightly different compared to our reference plots.
Thanks
Kevin
|
By Nevron Support - Tuesday, November 3, 2015
Hi Kevin,
There was indeed a problem with the bar width in the case of stack / cluster - in general this was related to a slight improvement related to the ability to specify logical bar width. It is fixed now and we'll publish the SP today.
|
|