By Steve Murray - Thursday, December 24, 2015
 I am trying to create a YTD chart for costs (Monthly, Local, Data, International and Roaming). The information is contained in a Sharepoint Teamsite list which is 15,000 records. The fields I want to SUM are contained within the individual records, but each record has all of the fields (Monthly, Local, Data, International and Roaming). I am trying to create a YTD chart for costs (Monthly, Local, Data, International and Roaming). The information is contained in a Sharepoint Teamsite list which is 15,000 records. The fields I want to SUM are contained within the individual records, but each record has all of the fields (Monthly, Local, Data, International and Roaming).
The YTD Chart works if I place a filter on Month="10"; but doesn't work and displays nothing if I remove the filter.
Does Nevron Chart support lookups with 15,000 records, multiple fields?
I am attaching screenshots of the Sharepoint code.
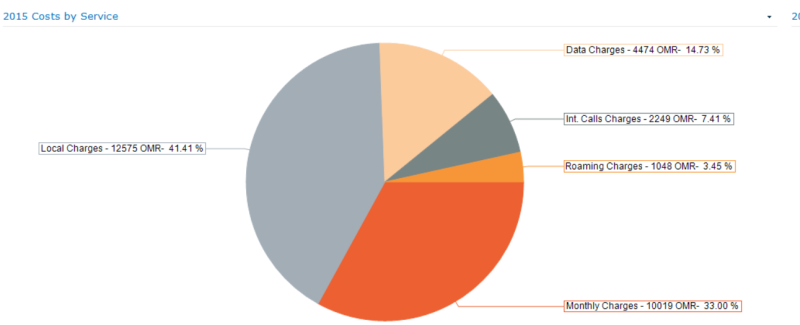
1) Screenshot of chart working when I use a filter for Monnth="10"
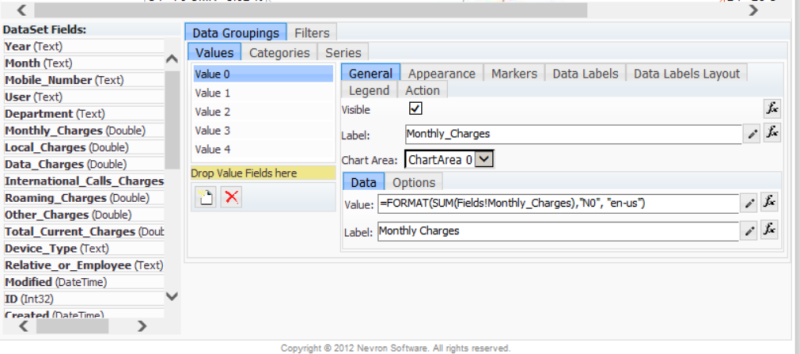
2) Second screenshot is for value definitions
3) Third screenshot is for filter setting.
|
By Steve Murray - Sunday, December 27, 2015
Problem resolved.... Below are my Value settings.... Still don't know how to get those commas inserted into the number values.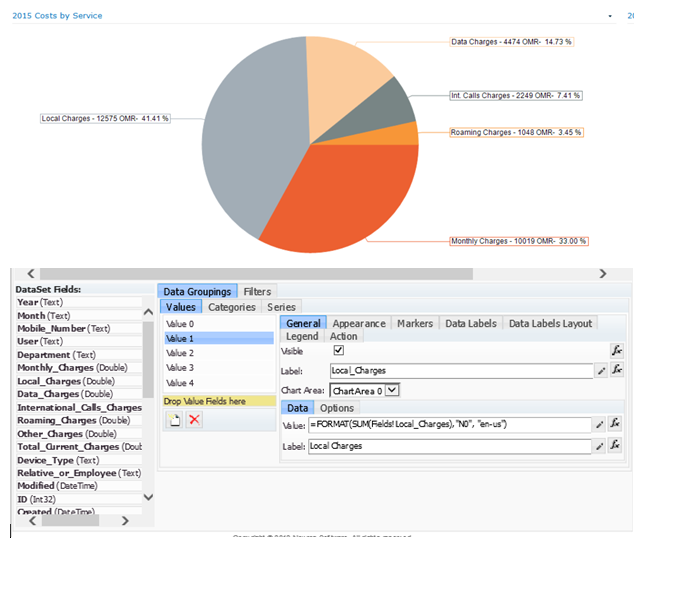
|
By Nevron Support - Monday, December 28, 2015
Please, take a look at the following Forum topic:
https://www.nevron.com/Forum/9497/Rounding-Percentages-and-Numbers-adding-a-second-row-in-legend-so-it-displays-two-lines-per-box
|
|