By Steve Murray - Sunday, December 27, 2015
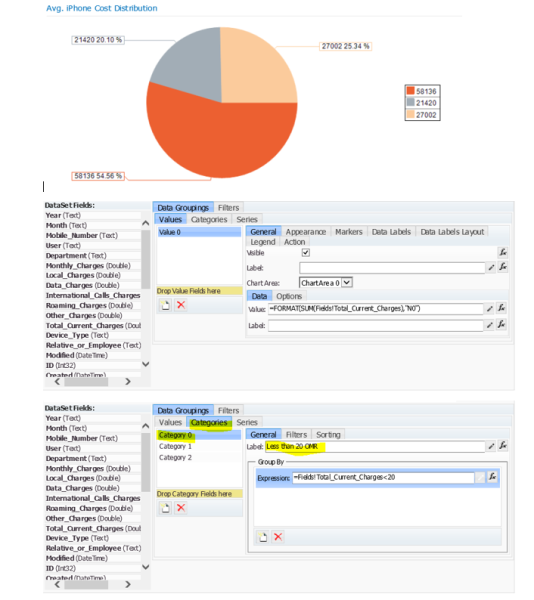
I am unable to pass the "Label" from a Category Data Grouping. I am grouping by Category to distinguish costs:
Labels are "Less than 20 OMR", "Between 20 and 35 OMR" and "Greater than 35 OMR". The logic for each of the Category groupings is working fine e.g. (=Fields!Total_Current_Charges<20) and displays the <value> and <percent>, but the Label I assign to each Category grouping does not get passed back to the chart. Below is a screenshot of my configuration.
Thanks in advance!
|
By Nevron Support - Monday, December 28, 2015
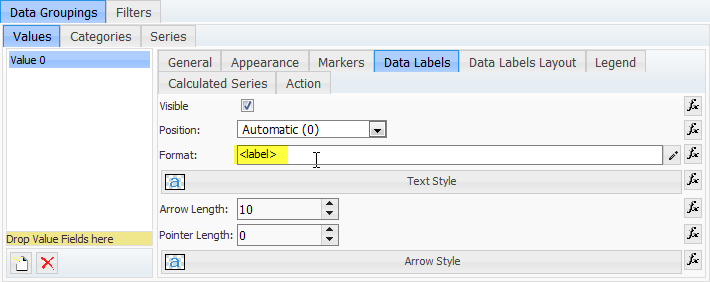
You can’t pass category labels to the pie chart data labels like that. Also, you should not use the FORMAT function in the Data -> Value field.
You should consider using only <label> in the Data Groupings -> Values -> Data Labels -> Format field:
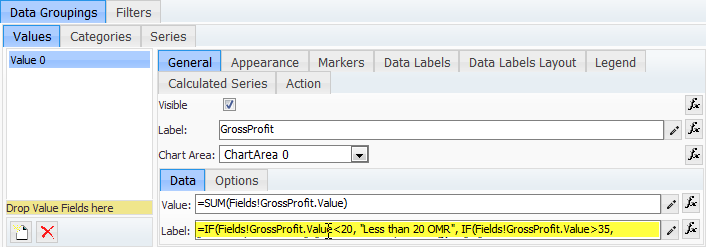
Then, in the Data Groupings -> Values -> General -> Data -> Label field, use an expression like this:
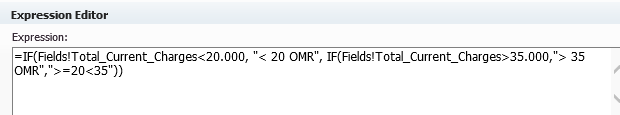
=IF(Fields!Total_Current_Charges<20, "Less than 20 OMR",
IF(Fields!Total_Current_Charges>35, "Greater than 35 OMR", "Between 20 and 35 OMR")) + " - " +
FORMAT(SUM(Fields!GrossProfit.Value), "N0", "en-us") + " - " +
FORMAT((SUM(Fields!GrossProfit.Value)/SUM(Parent.Fields!GrossProfit.Value)), "P0", "en-us")
|
By Steve Murray - Monday, December 28, 2015
 Thanks for your prompt reply. I made the recommended changes (screenshot of two Format statements); but now gives Thanks for your prompt reply. I made the recommended changes (screenshot of two Format statements); but now gives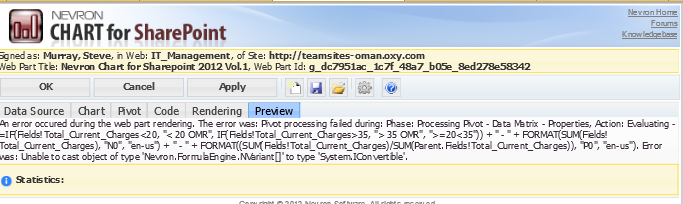 me an error. me an error.
|
By Nevron Support - Monday, December 28, 2015
This is because the expression returns an array. Can you send a snapshot of your data - the field of interest is the "Total_Current_Charges".
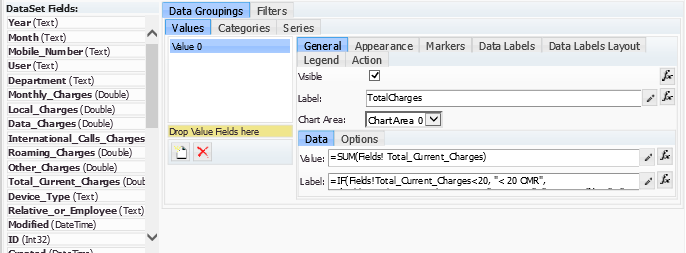
Since you have category grouping, you may need to update your expression with FIRST for the Total_Current_Charges e.g.:
=IF(FIRST(Fields!Total_Current_Charges)<20, "Less than 20 OMR",
IF(FIRST(Fields!Total_Current_Charges)>35, "Greater than 35 OMR", "Between 20 and 35 OMR")) + " - " +
FORMAT(SUM(Fields!GrossProfit.Value), "N0", "en-us") + " - " +
FORMAT((SUM(Fields!GrossProfit.Value)/SUM(Parent.Fields!GrossProfit.Value)), "P0", "en-us")
|
By Steve Murray - Monday, December 28, 2015
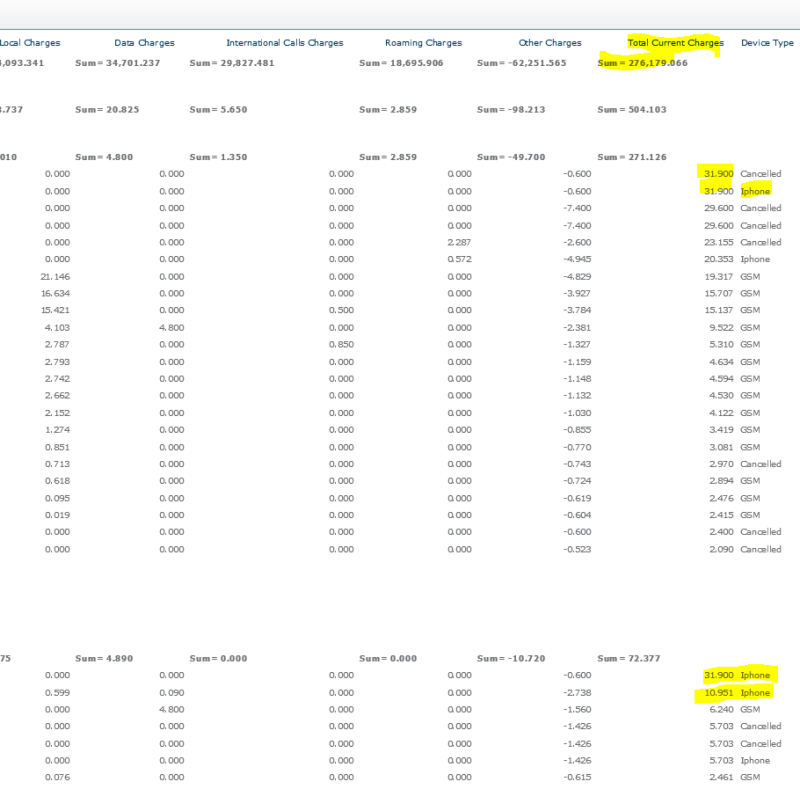
Thanks.... I tried your "First" suggestion.... no joy. I have attached a snapshot and a copy of November's data (minus cell number, department, name.) Appreciate your help.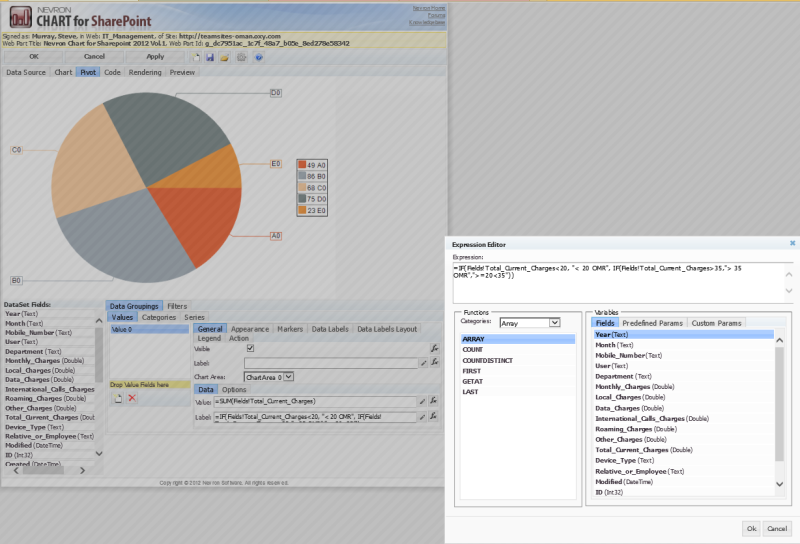
|
By Steve Murray - Tuesday, December 29, 2015
 No joy yet. Attached is the requested information. No joy yet. Attached is the requested information.
|
By Steve Murray - Wednesday, December 30, 2015
 Still no joy yet.... This seems to be a pretty straight forward chart; however, I am unable to "pass" the filter criteria labels to either the Legend or the pie chart Data Labels. Still no joy yet.... This seems to be a pretty straight forward chart; however, I am unable to "pass" the filter criteria labels to either the Legend or the pie chart Data Labels.
Copy of chart w/o labels and logic.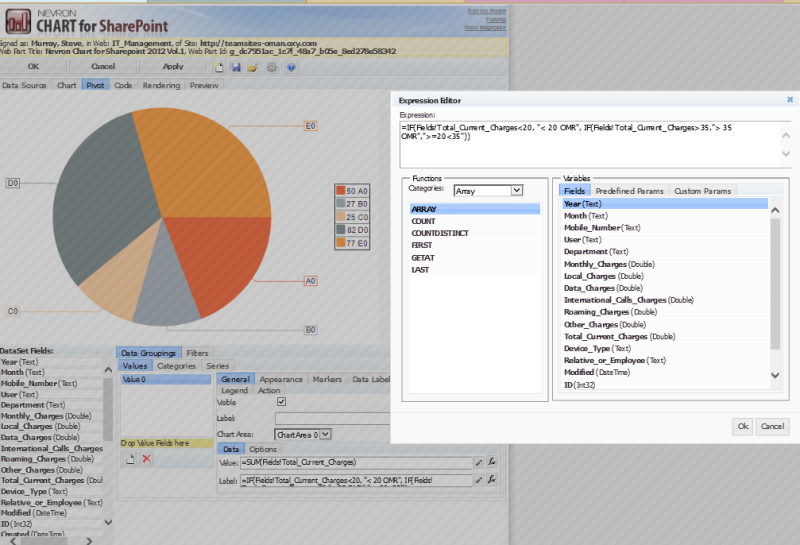
|
By Steve Murray - Wednesday, January 6, 2016
 I am still not able to pass labels to the Label: or the Legend. I am still not able to pass labels to the Label: or the Legend.
Expression appears to work correctly as the percentages are correct. Below is the expression and a picture of the chart.
|
By Nevron Support - Wednesday, January 6, 2016
Steve,
Can you send a snapshot of your data (in Excel spreadsheet). We are going to prepare an example for you.
|
By Steve Murray - Wednesday, January 6, 2016
Attached is Jan/Feb data from Sharepoint list. When creating a chart, I set a filter for Iphone charges.
Thanks for the helping hand(mind)!
|
By Nevron Support - Monday, January 11, 2016
Hello Steve,
Thank you for providing the sample data. Following is the resulting Pie chart:
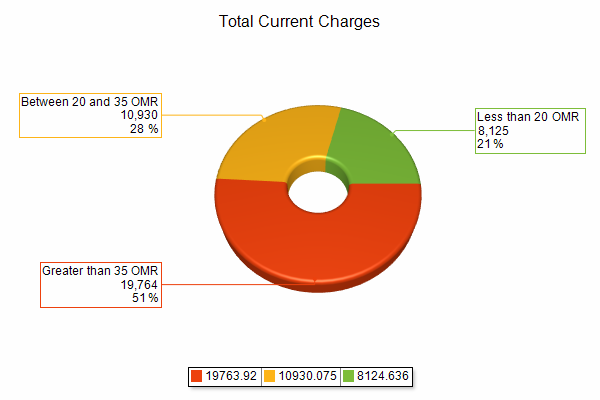
Attached, you can also find the chart template file.
Let us know if you have any questions or if you need assistance.
|
By Steve Murray - Saturday, January 16, 2016
Good news! Chart is working properly. Still don't know how to make the Labels appear on two lines. Many thanks for your help. You guys are awesome!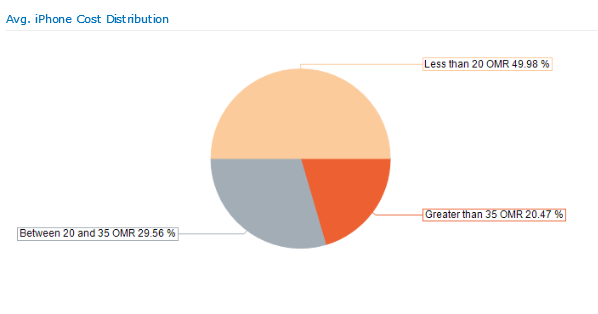
|
By Nevron Support - Monday, January 18, 2016
Hi Steve,
We are glad that we were able to help.
To have the labels on two, or multiple lines, you simply need to break the line in the expression editor like this:
=IF(FIRST(Fields!Total_Current_Charges)<20, "Less than 20 OMR",
IF(FIRST(Fields!Total_Current_Charges)>35, "Greater than 35 OMR", "Between 20 and 35 OMR")) + "
" +
FORMAT(SUM(Fields!Total_Current_Charges), "N0", "en-us") + "
" +
FORMAT((SUM(Fields!Total_Current_Charges)/SUM(Parent.Fields!Total_Current_Charges)), "P0", "en-us")
|
By Steve Murray - Monday, January 18, 2016
That was too easy! I wish the online documentation said "How to obtain 2 or 3 line labels" on your charts. In the expression editor for Data Labels, press enter and add a second line. I looked everywhere in the online documentation. Off and running, thanks!
|
|