By Mark Malburg - Wednesday, March 2, 2016
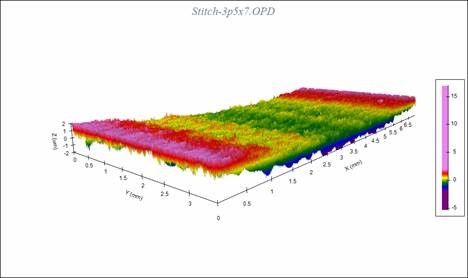
For a grid surface chart, is there a way to limit the legend range to be the range of the Y-axis (not the data)? For example, this looks pretty weird. It looks even worse when the data has outliers.
|
By Nevron Support - Wednesday, March 2, 2016
Hi Mark,
When the palette legend item is automatically generated it will take the surface min/max y values. In order to work around this you need to create a custom legend as shown in the following example:
All Examples \ Panels \ Legend \ Palette Item
Hope this helps – let us know if you meet any problems or have any questions.
|
|