Profile Picture

Multiple charts with linked X-Axis: How to force same Axis-Label-Size for all Charts

Posted By joern kunze 7 Years Ago

Multiple charts with linked X-Axis: How to force same Axis-Label-Size...

Author
Message
joern kunze
Problem Posted 7 Years Ago
View Quick Profile
Junior Member

Junior Member (13 reputation)Junior Member (13 reputation)Junior Member (13 reputation)Junior Member (13 reputation)Junior Member (13 reputation)Junior Member (13 reputation)Junior Member (13 reputation)Junior Member (13 reputation)Junior Member (13 reputation)

Group: Forum Members
Last Active: 2 Years Ago
Posts: 86, Visits: 218
Hello Experts,

Problem: X-Axis Labels have different font size for multiple charts with linked X-Axis (Chart.Fit2DAxisContent = true)

I have alligned 3 charts next to each other:
https://www.nevron.com/forum/uploads/images/5c944cdf-1d00-45d8-8151-b731.jpg
 
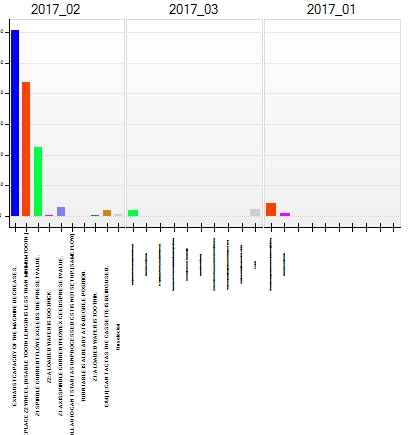
=> I would like to have X Axis Label font size for middle and left Chart same as for the first Chart ("2017_02")
Due to some automatic size setting the middle and left Chart X Axis Label size is much smaller.


I use the following settings for the charts:

for (i = 0; i < iChartCount; i++) {
          _oChart[i].Fit2DAxisContent = true;
...
          _oChart[i].Axis(StandardAxis.PrimaryX).ScaleConfigurator.LabelFitModes = new LabelFitMode[]{ LabelFitMode.Rotate90};
}
....

//----- link axes
for (i = 0; i < iChartCount; i++) {
for (int iSlave = 0; iSlave < iChartCount; iSlave++) {
      if (iSlave != i) {
          _oChart[i].Chart.Axis(StandardAxis.PrimaryX).Slaves.Add(_oChart[iSlave].Chart.Axis(StandardAxis.PrimaryX));
          _oChart[i].Chart.Axis(StandardAxis.PrimaryY).Slaves.Add(_oChart[iSlave].Chart.Axis(StandardAxis.PrimaryY));
      }
}
}     

// Refresh
   _NevronChart.document.Calculate();
    _NevronChart.document.RecalcLayout(_NevronChart.View.Context);
    _NevronChart.Refresh();


// test
    NLinearScaleConfigurator oXScale = (NLinearScaleConfigurator)_NevronChart.Charts[0].Axis(StandardAxis.PrimaryX).ScaleConfigurator;
    NTextStyle hTextStyle = oXScale.LabelStyle.TextStyle;
    string sFontSize = hTextStyle.FontStyle.EmSize.ToString(); // always 9pt for all charts
==> sFontSize  is the same for all 3 Charts - but obviously the displayed size is not the same

So how do I force the middle and left Chart to have the same X Axis Label size like the first left hand Chart ?

Thanks for help,
Joern


Nevron Support
Posted 7 Years Ago
View Quick Profile
Supreme Being

Supreme Being (4,329 reputation)Supreme Being (4,329 reputation)Supreme Being (4,329 reputation)Supreme Being (4,329 reputation)Supreme Being (4,329 reputation)Supreme Being (4,329 reputation)Supreme Being (4,329 reputation)Supreme Being (4,329 reputation)Supreme Being (4,329 reputation)

Group: Forum Members
Last Active: Last Year
Posts: 3,039, Visits: 3,746
Hi Joern,
Most likely the font difference is caused by a feature which does not allow the chart plot to get very small relative to the axes. To disable this feature you need to set the MaxDockZoneMargins property of the chart - for example:

NCartesianChart chart = (NCartesianChart)nChartControl1.Charts[0];    
chart.MaxDockZoneMargins = new NMarginsL(1000000);    
chart.MinDockZoneMargins = new NMarginsL(0);

Hope this helps - let us know if the problem persists...


Best Regards,
Nevron Support Team


joern kunze
Posted 7 Years Ago
View Quick Profile
Junior Member

Junior Member (13 reputation)Junior Member (13 reputation)Junior Member (13 reputation)Junior Member (13 reputation)Junior Member (13 reputation)Junior Member (13 reputation)Junior Member (13 reputation)Junior Member (13 reputation)Junior Member (13 reputation)

Group: Forum Members
Last Active: 2 Years Ago
Posts: 86, Visits: 218
unfortunatly, the proposed solution doesnt work at. But I just updated to the latest Nevronhart version and discovered, that for chart 2 and 3 there was an X-Axis Title (which was invisible in the previous Nevron Chart version) ) - and thats why the X-Axis Labels have been scaled to such a tiny size.
Now the X-Axis Labels have the same Font-size - but for very large X-Axis-Labels, the Labels are not visible in full.

So I tried to set for each Chart the Fit2DAxisContent :
 oChart.Fit2DAxisContent = true;

Please note: To see the Chart-Pane of the first Chart I set for debugging purpose for the first Chart :
oChart01.BorderStyle = new NStrokeBorderStyle();

Now the X-Axis Labels are fully visible - but the Charts are not alligned correctly anymore :
https://www.nevron.com/forum/uploads/images/83cb3269-d578-4536-a8df-9b85.jpg

when I set  oChart.Fit2DAxisContent = false and use only X-Axis Labels with a few letters, everything works fine:
https://www.nevron.com/forum/uploads/images/b11e72da-9e56-46d7-89f9-29e7.jpg
Is there a way to force the charts to be correctly alligned ?
I tried to do it by setting:
  oChart.Fit2DAxisContent = false;
and applying some Padding:
oChart.Padding = new NMarginsL(0, 0, 0, iPaddingSouth);

But here I have the problem, that I cant get the actual length in pixel of the longest X-Axis Label to set iPaddingSouth correctly.
Is there a way to get the neccessary length for the longest X-Axis-label to adjust the "southbound" padding?

Nevron Support
Posted 7 Years Ago
View Quick Profile
Supreme Being

Supreme Being (4,329 reputation)Supreme Being (4,329 reputation)Supreme Being (4,329 reputation)Supreme Being (4,329 reputation)Supreme Being (4,329 reputation)Supreme Being (4,329 reputation)Supreme Being (4,329 reputation)Supreme Being (4,329 reputation)Supreme Being (4,329 reputation)

Group: Forum Members
Last Active: Last Year
Posts: 3,039, Visits: 3,746
Hi Joern,

You need to use panel side guidelines for this purpose - the following code shows how to align two charts bottom side:

   nChartControl1.Panels.Clear();

   NCartesianChart chart1 = new NCartesianChart();
   chart1.DockMode = PanelDockMode.Left;
   chart1.BoundsMode = BoundsMode.Stretch;
   chart1.Size = new NSizeL(new NLength(50, NRelativeUnit.ParentPercentage), new NLength(0));
   chart1.Axis(StandardAxis.PrimaryX).ScaleConfigurator.Title.Text = "Some text";
   nChartControl1.Panels.Add(chart1);

   NCartesianChart chart2 = new NCartesianChart();
   chart2.DockMode = PanelDockMode.Left;
   chart2.BoundsMode = BoundsMode.Stretch;
   chart2.Size = new NSizeL(new NLength(50, NRelativeUnit.ParentPercentage), new NLength(0));
   nChartControl1.Panels.Add(chart2);

   NSideGuideline sideGuideline = new NSideGuideline(PanelSide.Bottom);
   sideGuideline.Targets.Add(chart1);
   sideGuideline.Targets.Add(chart2);

   nChartControl1.document.RootPanel.Guidelines.Add(sideGuideline);


Hope this helps - let us know if you meet any problems or have any questions.

Best Regards,
Nevron Support Team


joern kunze
Posted 7 Years Ago
View Quick Profile
Junior Member

Junior Member (13 reputation)Junior Member (13 reputation)Junior Member (13 reputation)Junior Member (13 reputation)Junior Member (13 reputation)Junior Member (13 reputation)Junior Member (13 reputation)Junior Member (13 reputation)Junior Member (13 reputation)

Group: Forum Members
Last Active: 2 Years Ago
Posts: 86, Visits: 218
... thanks for the hint to use NSideGuideline. I tried this and got the following result:
https://www.nevron.com/forum/uploads/images/60ad740b-11a1-487e-ada9-594f.jpg

the labels for the X-Axis are looking good - but now the Y-Axis label of the first chart causing the first chart1 itself to become very narrow compared to chart2 and chart3.
What must I do now to get the same size for each chart ?

Thanks again  for help,
Joern


Nevron Support
Posted 7 Years Ago
View Quick Profile
Supreme Being

Supreme Being (4,329 reputation)Supreme Being (4,329 reputation)Supreme Being (4,329 reputation)Supreme Being (4,329 reputation)Supreme Being (4,329 reputation)Supreme Being (4,329 reputation)Supreme Being (4,329 reputation)Supreme Being (4,329 reputation)Supreme Being (4,329 reputation)

Group: Forum Members
Last Active: Last Year
Posts: 3,039, Visits: 3,746
Hi Joern,

You cannot easily achieve three charts with the same size and at the same time equal x size. However a simple workaround is to use a single chart with many x axes - check out the following code:

   NCartesianChart chart1 = (NCartesianChart)nChartControl1.Charts[0];
   chart1.BoundsMode = BoundsMode.Stretch;

   NAxis axisX1 = chart1.Axis(StandardAxis.PrimaryX);
   NAxis axisX2 = chart1.Axis(StandardAxis.SecondaryX);
   NAxis axisX3 = ((NCartesianAxisCollection)chart1.Axes).AddCustomAxis(AxisOrientation.Horizontal, AxisDockZone.FrontBottom);

   axisX1.Anchor = new NDockAxisAnchor(AxisDockZone.FrontBottom, true, 0, 32);
   axisX1.Visible = true;

   axisX2.Anchor = new NDockAxisAnchor(AxisDockZone.FrontBottom, false, 34, 66);
   axisX2.Visible = true;

   axisX3.Anchor = new NDockAxisAnchor(AxisDockZone.FrontBottom, false, 68, 100);
   axisX3.ScaleConfigurator = new NOrdinalScaleConfigurator();
   axisX3.Visible = true;

   NBarSeries bar1 = new NBarSeries();
   bar1.Values.Add(10);
   bar1.Values.Add(20);
   chart1.Series.Add(bar1);

   NBarSeries bar2 = new NBarSeries();
   bar2.Values.Add(10);
   bar2.Values.Add(20);
   chart1.Series.Add(bar2);
   bar2.DisplayOnAxis(StandardAxis.PrimaryX, false);
   bar2.DisplayOnAxis(StandardAxis.SecondaryX, true);

   NBarSeries bar3 = new NBarSeries();
   bar3.Values.Add(10);
   bar3.Values.Add(20);
   chart1.Series.Add(bar3);
   bar3.DisplayOnAxis(StandardAxis.PrimaryX, false);
   bar3.DisplayOnAxis(axisX3.AxisId, true);

It shows how to have three horizontal axes that share the same plot side. Let us know if you meet any problems.


Best Regards,
Nevron Support Team


Similar Topics


Reading This Topic