|
rich dudley
|
|
|
Group: Forum Members
Posts: 33,
Visits: 76
|
when setting the size of the chart or the chartControl I dont seem to get a predictable output size of the file exported fromt the chartControl. For example: int Length = 516;
int Height = 288;
NCartesianChart chart = (NCartesianChart)chartControl.Charts[0];
chart.Size = new NSizeL(new NLength(Length, NGraphicsUnit.Point), new NLength(Height, NGraphicsUnit.Point));
The size of the chart output by this is 482.023 pt x 388.919 pt. If I add the following: chart.BoundsMode = BoundsMode.Stretch;
The size of the chart becomes 682.023 pt x 388.919 pt. How do I get a predictable size output? I currently have export it repeatedly, gradually adjusting the size until it is the size I want.
|
|
|
|
|
Nevron Support
|
|
|
Group: Administrators
Posts: 3.1K,
Visits: 4.2K
|
Hi Rich, The BoundsMode property specifies how the chart fits inside the bounds determined by the layout - in case of Fit the chart maintains aspect ratio and in case of Stretch it stretches to fill the available size without maintiaining aspect. The following code shows how to export a chart control where the chart occupies 400x300 pixels at 96 dpi:
using (NChartControl chartControl = new NChartControl())
{
NChart chart = chartControl.Charts[0];
chart.DockMode = PanelDockMode.Fill;
chart.BoundsMode = BoundsMode.Stretch;
NBarSeries bar = new NBarSeries(); bar.Values.Add(10);
bar.Values.Add(20);
bar.Values.Add(20); chart.Series.Add(bar); chartControl.ImageExporter.SaveToFile("c:\\temp\\chartImage.png", new NSize(400, 300), new NResolution(96, 96), new NPngImageFormat());
}
You can also take a look at the examples shipped with the control showing how BoundsMode works:
All Examples \ Layout \ Bounds Mode - Fit
All Examples \ Layout \ Bounds Mode - Stretch
Hope this helps - let us know if you meet any problems.
Best Regards,
Nevron Support Team
|
|
|
|
|
rich dudley
|
|
|
Group: Forum Members
Posts: 33,
Visits: 76
|
That seems to be almost there, except I cant seem to get rid of the white space around the graph. It is the correct size now including the padding, but is all that space necessary? I tried the following, but it didn't seem to change anything: chart.Margins = new NMarginsL(0);
chart.Padding = new NMarginsL(0);
chart.BoundsMode = BoundsMode.Stretch;
|
|
|
|
|
Nevron Support
|
|
|
Group: Administrators
Posts: 3.1K,
Visits: 4.2K
|
Hi Rich,
How do you specify the chart size relative to the size of the control? In the reference code we posted the chart uses docking so it occupies all the avaiable space. In your case you may need to adjust the Location / Size properties of the chart panel to match the 0, 0 and rightmost, bottom coordinates of the chart if you don't use docking:
chart.Location = new NPointL(0, 0);
chart.Size = new NSizeL(new NLength(100, NRelativeUnit.ParentPercentage), new NLength(100, NRelativeUnit.ParentPercentage)));
Best Regards,
Nevron Support Team
|
|
|
|
|
rich dudley
|
|
|
Group: Forum Members
Posts: 33,
Visits: 76
|
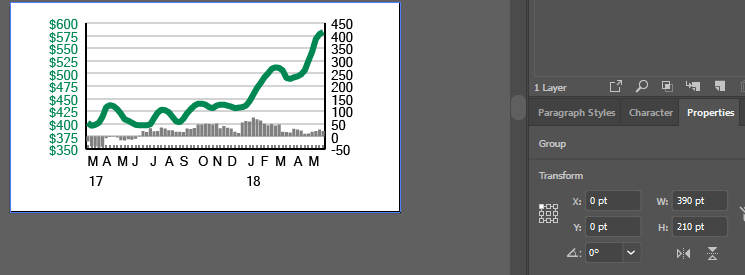
Yes! location is what I was missing but it is still slightly off. The top label is part way cutoff. Should I just adjust the location slightly, or is there a better way of doing it? chartControl.Size = new Size(options.width, options.height); NCartesianChart chart = (NCartesianChart)chartControl.Charts[0]; chart.Location = new NPointL(0, 0); chart.Size = new NSizeL(new NLength(100, NRelativeUnit.ParentPercentage), new NLength(100, NRelativeUnit.ParentPercentage)); chart.BoundsMode = BoundsMode.Stretch; 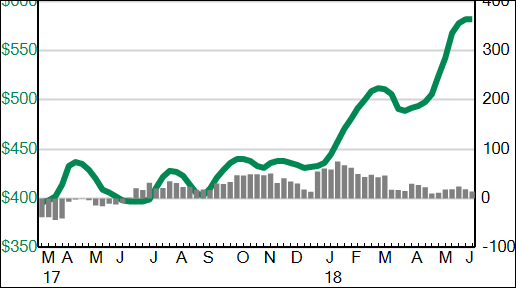
|
|
|
|
|
Nevron Support
|
|
|
Group: Administrators
Posts: 3.1K,
Visits: 4.2K
|
Hi Rich,
Yes currently the chart does not measure how much labels fall outside the axis range, but we plan to introduce this feature in the upcoming release of the control. For the time being you can apply some margins from the top side of the control - for example: NChart chart = nChartControl1.Charts[0];
chart.Margins = new NMarginsL(0, 10, 0, 0);
Best Regards,
Nevron Support Team
|
|
|
|
|
rich dudley
|
|
|
Group: Forum Members
Posts: 33,
Visits: 76
|
This is now doing what I want it to do, but I would like to understand exactly what role the NResolution plays. I currently am using it at 96, 96 as you suggested, but after playing around with other values I am unsure of what its doing.
Setting it to 1,1 made the graph look fairly normal, but missing all labels.
Setting it to 900,900 destroyed it.
This is the line of code Im using:
chartControl.ImageExporter.SaveToFile(options.OutputPath + options.ChartName + ".svg", new NSize(options.width, options.height), new NResolution(96, 96), svgImageFormat);
|
|
|
|
|
Nevron Support
|
|
|
Group: Administrators
Posts: 3.1K,
Visits: 4.2K
|
Hi Rich, The target resolution controls the dpi of the target device and how sizes specified in points, inches etc. are converted to pixels. This matters when you print or display the chart on high res display (4K for example), because you want the font size to remain constant relative to the viewer but actually increase in terms of rasterized pixels. In the case of SVG you can simply specify 96 and adjust the labels, margins etc. based on that resolution as the SVG is scalable and the target resolution there does not matter except for the unit conversions.
Best Regards,
Nevron Support Team
|
|
|
|
|
rich dudley
|
|
|
Group: Forum Members
Posts: 33,
Visits: 76
|
I am currently using this code to set the overall size of the chart:
chartControl.Size = new Size(options.width, options.height);
chartControl.BackgroundStyle.FrameStyle.Visible = false;
NCartesianChart chart = (NCartesianChart)chartControl.Charts[0];
chart.Location = new NPointL(0, 0);
chart.Size = new NSizeL(new NLength(100, NRelativeUnit.ParentPercentage), new NLength(100, NRelativeUnit.ParentPercentage));
if (addMargin)
{
chart.Margins = new NMarginsL(0, (int)(options.height*0.05), 0, 0);
}
chart.BoundsMode = BoundsMode.Stretch;
This works as intended, but I was wondering if it is possible to specify the size of the axis instead? This would mean the size of the chart would not fluctuate based on the width of the label. Currently, I specify the total width which remains static as long as the number of characters in the YAxis label remains the same, but if it bumps from a single digit label to a two digit label the chart shrinks to make room. Preferred behavior would be to increase the size of the entire chart to accommodate the extra digit, while ensuring that the length of the axis remains the same as past charts.
|
|
|
|
|
Nevron Support
|
|
|
Group: Administrators
Posts: 3.1K,
Visits: 4.2K
|
Hi Rich, You can disable axis content fitting (using Fit2DAxisContent property of the NCartesianChart object) and that way the control bounds will static regardless of the axis labels. You'll then need to implement some logic that repositions the control based on the label size... In any case there is no build in function that allows you have static plot size and dynamic control size.
Best Regards,
Nevron Support Team
|
|
|
|