Profile Picture

Zoom applied to chart does not consider nSeries.InflateMargins = true; setting

Posted By joern kunze 5 Years Ago

Zoom applied to chart does not consider nSeries.InflateMargins = true;...

Author
Message
joern kunze
Problem Posted 5 Years Ago
View Quick Profile
Junior Member

Junior Member (13 reputation)Junior Member (13 reputation)Junior Member (13 reputation)Junior Member (13 reputation)Junior Member (13 reputation)Junior Member (13 reputation)Junior Member (13 reputation)Junior Member (13 reputation)Junior Member (13 reputation)

Group: Forum Members
Last Active: 2 Years Ago
Posts: 86, Visits: 218
Hi Experts,
when I use some data series with
nSeries.InflateMargins = true;
a zoom in the border area does not consider the extra margin (red square markes the area which is to be zoomed with the mouse):
https://www.nevron.com/forum/uploads/images/1335faab-ab9d-4a28-be58-ca77.jpg

the result looks like:
https://www.nevron.com/forum/uploads/images/197b99f3-c446-4d9e-bbf7-02fd.jpg

How can I achive that the extra margin is keept even when a zoom was applied (so the left Y-Axis should have a range from 5...7, not from 5...6) ?

Thanks for your help,
Best regards,
Joern

Nevron Support
Posted 5 Years Ago
View Quick Profile
Supreme Being

Supreme Being (4,329 reputation)Supreme Being (4,329 reputation)Supreme Being (4,329 reputation)Supreme Being (4,329 reputation)Supreme Being (4,329 reputation)Supreme Being (4,329 reputation)Supreme Being (4,329 reputation)Supreme Being (4,329 reputation)Supreme Being (4,329 reputation)

Group: Forum Members
Last Active: Last Year
Posts: 3,039, Visits: 3,746
Hi Joern,

Try using:
chart.Axis(StandardAxis.PrimaryX).UseRangeInflateWhenZoomed = true;
chart.Axis(StandardAxis.PrimaryY).UseRangeInflateWhenZoomed = true;
Let us know if you meet any problems.

Best Regards,
Nevron Support Team


joern kunze
Posted 5 Years Ago
View Quick Profile
Junior Member

Junior Member (13 reputation)Junior Member (13 reputation)Junior Member (13 reputation)Junior Member (13 reputation)Junior Member (13 reputation)Junior Member (13 reputation)Junior Member (13 reputation)Junior Member (13 reputation)Junior Member (13 reputation)

Group: Forum Members
Last Active: 2 Years Ago
Posts: 86, Visits: 218
... I did as you proposed and changed the UseRangeInflateWhenZoomed to true :

     oChart.Axis(StandardAxis.PrimaryX).UseRangeInflateWhenZoomed = true;
      oChart.Axis(StandardAxis.PrimaryY).UseRangeInflateWhenZoomed = true;
      oChart.Axis(StandardAxis.SecondaryY).UseRangeInflateWhenZoomed = true;

Unfortunatly, this does not work when the 2nd series is assigned to the Secondary-Y-axis. When I assign both series to the primaryY axis it is working though. 
If it is helpfull, I can send you my little demo project if you can not reproduce the issue.

Nevron Support
Posted 5 Years Ago
View Quick Profile
Supreme Being

Supreme Being (4,329 reputation)Supreme Being (4,329 reputation)Supreme Being (4,329 reputation)Supreme Being (4,329 reputation)Supreme Being (4,329 reputation)Supreme Being (4,329 reputation)Supreme Being (4,329 reputation)Supreme Being (4,329 reputation)Supreme Being (4,329 reputation)

Group: Forum Members
Last Active: Last Year
Posts: 3,039, Visits: 3,746
Hi Joern,
Yes please send the demo app for review...

Best Regards,
Nevron Support Team


joern kunze
Posted 5 Years Ago
View Quick Profile
Junior Member

Junior Member (13 reputation)Junior Member (13 reputation)Junior Member (13 reputation)Junior Member (13 reputation)Junior Member (13 reputation)Junior Member (13 reputation)Junior Member (13 reputation)Junior Member (13 reputation)Junior Member (13 reputation)

Group: Forum Members
Last Active: 2 Years Ago
Posts: 86, Visits: 218
Now I have prepared an example which shows several problems I do have with the zoom .

Case 1: Zoomed area does not exactly match the actual mouse zoomed area

To reproduce start the attached example and press button "Test Zoom 1 Series" and zoom with the mouse the following range:
https://www.nevron.com/forum/uploads/images/d848b3ca-b2f7-414f-a12a-db59.jpg

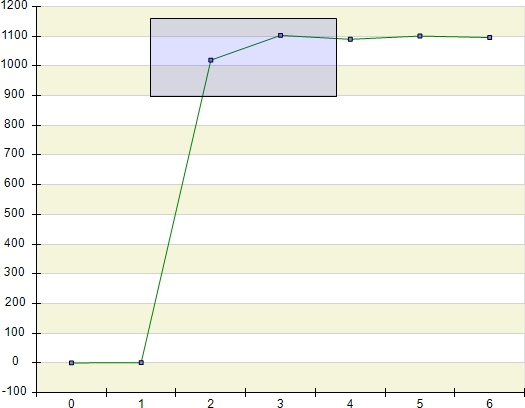
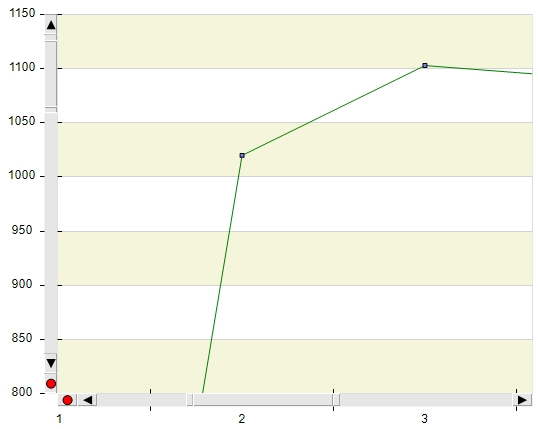
now the resulting plot starts with Y=800 instead with Y=900: 
https://www.nevron.com/forum/uploads/images/1ca3d5f2-48db-4245-be21-28c7.jpg
Note.
- the problem exists also when Series.InflateMargins=false
- This problem exists only if the zoom starts in the "extra margin" Y area of the plot (that means start zoom at Y >1100)
=> how can I avoid this behaviour ?

When Series.InflateMargins=true, a problem exists when zoom is applied to the lower Inflated Margin of the Y range:

Apply a mouse zoom like:
https://www.nevron.com/forum/uploads/images/a89d5c38-251d-4061-b7c3-388d.jpg
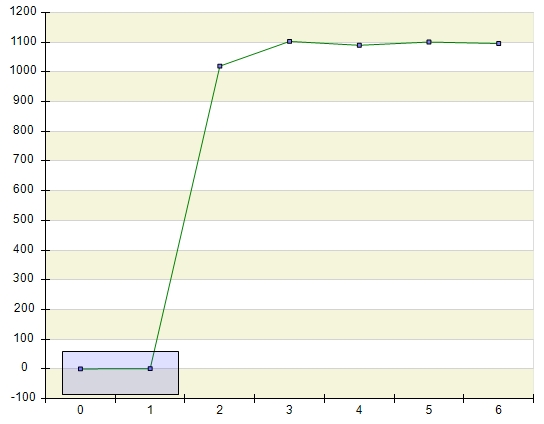
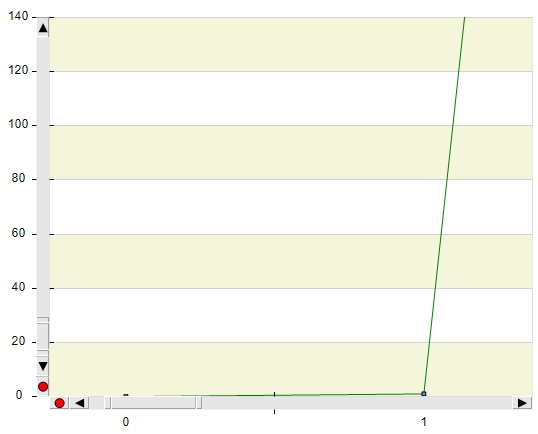
=> the resulting plot starts at Y= 0 instead of Y=-90:
https://www.nevron.com/forum/uploads/images/5b03b5ea-329f-4687-a70f-88c1.jpg

Case 2: Similar to Case 1 - but now with Logarithmic Scale
To reproduce the problem, restart the project and press button "LogarithmicScale"
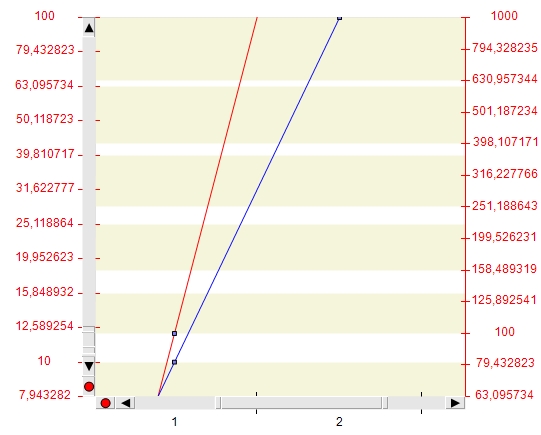
Now try the same like Case 1 and zoom starting within the extra margin area => now an additional problem occures:
oChart.Axis(StandardAxis.PrimaryY).PagingView.Enabled; returns false instead of true !!
(to see this, set a break at "// Case 2: Set break here and check bolYZoomActive" in  frmMain.cs-On_DataZoom-EndDrag
=> when the zoom starts somewhere in the middle and not within the extra margin area, it works ok though.

Case 3: How to set zoom for logarithmic 2nd Y axis properly ?
Unfortunatly, I could not get the zoom-setting of the Y2-axis working properly.
Please start the project and press  button "LogarithmicScale", then zoom like:
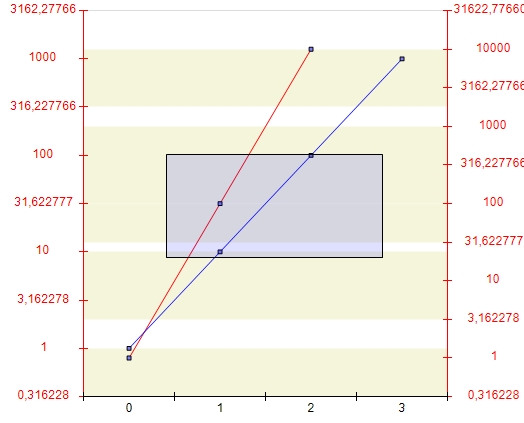
https://www.nevron.com/forum/uploads/images/cbd12bbb-1b4d-4a2d-8097-e5b4.jpg
results in:
https://www.nevron.com/forum/uploads/images/9d87b39b-1f85-484e-968a-c7f8.jpg
=> the left Y-axis looks ok, but the right Y2-axis is not scaled properly - probably my approach is wrong:
         // compute the new range based on factor
          NRange1DD axisContentRange = axis.ViewRange;
          double rangeLength = axisContentRange.End - axisContentRange.Begin;

          double begin = axisContentRange.Begin + beginFactor * rangeLength;
          double end = axisContentRange.Begin + endFactor * rangeLength;
=> please see On_DataZoom_EndDrag-method of the attached example code.

Thanks very much for your help !
Best regards,
Joern


Attachments
NevronChart_ProblemWithZoom.zip (460 views, 407.00 KB)
Nevron Support
Posted 5 Years Ago
View Quick Profile
Supreme Being

Supreme Being (4,329 reputation)Supreme Being (4,329 reputation)Supreme Being (4,329 reputation)Supreme Being (4,329 reputation)Supreme Being (4,329 reputation)Supreme Being (4,329 reputation)Supreme Being (4,329 reputation)Supreme Being (4,329 reputation)Supreme Being (4,329 reputation)

Group: Forum Members
Last Active: Last Year
Posts: 3,039, Visits: 3,746
Hi Joern,
The chart is functioning as intended - simply put when you zoom in to a specified range that range is first clamped to the available axis content range and then extended to the nearest tick. You can work around the first problem by having a series with invisible values that are outside the original point range (for example one that has values -99 to 1199). For the second issue you cannot have synchronized zooming and tick inflate at the same time. 
Hope this helps - let us know if you have any questions or meet any problems.

Best Regards,
Nevron Support Team


Similar Topics


Reading This Topic