Profile Picture

NVectorSeries Mode.Direction issue

Posted By Charlie Penny 4 Years Ago
Author
Message
Charlie Penny
Problem Posted 4 Years Ago
View Quick Profile
Forum Newbie

Forum Newbie (0 reputation)Forum Newbie (0 reputation)Forum Newbie (0 reputation)Forum Newbie (0 reputation)Forum Newbie (0 reputation)Forum Newbie (0 reputation)Forum Newbie (0 reputation)Forum Newbie (0 reputation)Forum Newbie (0 reputation)

Group: Forum Members
Last Active: 4 Years Ago
Posts: 0, Visits: 31
Hello,

I'm trying to plot a Vector2D chart of some data.

Due to the size of the vectors I'm only really interested in their position and direction, and just want to resize the vectors relative to my axes.

As I understand it, the option Mode.Direction should allow me to do this, with vectorSeries.XValues and vectorSeries.Values becoming the X and Y positions, and vectorSeries.X2Values and vectorSeries.Y2Values becoming the X and Y directions.

I can then resize the relative size of the arrows using MinVectorLength and MaxVectorLength.

However, when I implement this, I end up with all the vector arrows starting at positions based of vectorSeries.XValues and vectorSeries.Values but with directions that point into the centre of the plot.

In the case of the Nevron2D plot (http://examplesaspnetchart.nevron.com/) the arrows point to roughly (6.5, 5).

https://www.nevron.com/forum/uploads/images/da16b1d0-bbfb-4836-8e6f-207d.png


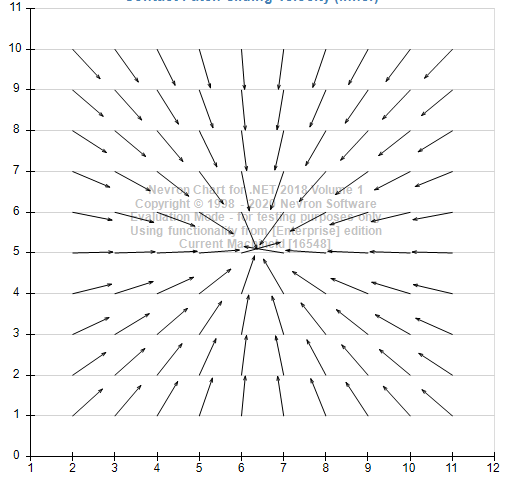
I see this behaviour in all sets of data I've tried (e.g. if the origin is in the centre of the chart, all vectors point towards the origin).

If anyone has any suggestions as to what is going on (or what I'm doing wrong), I'd be very happy to hear them!


Nevron Support
Posted 4 Years Ago
View Quick Profile
Supreme Being

Supreme Being (4,329 reputation)Supreme Being (4,329 reputation)Supreme Being (4,329 reputation)Supreme Being (4,329 reputation)Supreme Being (4,329 reputation)Supreme Being (4,329 reputation)Supreme Being (4,329 reputation)Supreme Being (4,329 reputation)Supreme Being (4,329 reputation)

Group: Forum Members
Last Active: Last Year
Posts: 3,039, Visits: 3,746
Hi Charlie,

Thank you for your interest in Nevron Chart for .NET.

Can you post the code you use to create the chart for review? Most likely you missed to specify that the vector series must use the specified x values:

vectorSeries.UseXValues = true;
vectorSeries.Mode = VectorSeriesMode.Direction;

Also, we just tested the vector series in the latest version and it was working properly - what is the version of the control you're testing with?

Best Regards,
Nevron Support Team


Charlie Penny
Posted 4 Years Ago
View Quick Profile
Forum Newbie

Forum Newbie (0 reputation)Forum Newbie (0 reputation)Forum Newbie (0 reputation)Forum Newbie (0 reputation)Forum Newbie (0 reputation)Forum Newbie (0 reputation)Forum Newbie (0 reputation)Forum Newbie (0 reputation)Forum Newbie (0 reputation)

Group: Forum Members
Last Active: 4 Years Ago
Posts: 0, Visits: 31
Thanks for the swift reply.

Unfortunately I am already using series.UseXValues = true.

The version of Nevron I am using is down being as 19.2.26.12 in our system.

My code is below;


    var series = (NVectorSeries)chart.Series.Add(SeriesType.Vector);
    series.Legend.DisplayOnLegend = Control.Legend;
    series.Legend.Mode = SeriesLegendMode.None;
    series.DataLabelStyle.Visible = false;
    series.InflateMargins = true;
    series.UseXValues = true;
    series.MinArrowHeadSize = new NSizeL(2, 3);
    series.MaxArrowHeadSize = new NSizeL(4, 6);

    series.Mode = VectorSeriesMode.Direction;
    series.MinVectorLength = new NLength(30f);
    series.MaxVectorLength = new NLength(30f);

    series.FillStyle = new NColorFillStyle(Color.Black);
    series.BorderStyle.Color = Color.Black;

    double x = 0, y = 0;
    int k = 0;
    for ( int i = 0; i < 10; i++ )
    {
      x = 1;
      y += 1;
      for ( int j = 0; j < 10; j++ )
      {
        x += 1;
        double dx = Math.Sin(x / 3.0) * Math.Cos((x - y) / 4.0);
        double dy = Math.Cos(y / 8.0) * Math.Cos(y / 4.0);
        series.XValues.Add(x);
        series.Values.Add(y);
        series.X2Values.Add(dx);
        series.Y2Values.Add(dy);
        series.BorderStyles[k] = new NStrokeStyle(1, Color.Black);
        k++;
      }
    }


Nevron Support
Posted 4 Years Ago
View Quick Profile
Supreme Being

Supreme Being (4,329 reputation)Supreme Being (4,329 reputation)Supreme Being (4,329 reputation)Supreme Being (4,329 reputation)Supreme Being (4,329 reputation)Supreme Being (4,329 reputation)Supreme Being (4,329 reputation)Supreme Being (4,329 reputation)Supreme Being (4,329 reputation)

Group: Forum Members
Last Active: Last Year
Posts: 3,039, Visits: 3,746
Hi Charlie,
It looks like this is a problem with this particular version - we get the following output:


Another good test is to replace the direction vector dx/dy with i/j so that the vectors point in the direction specified by the of the grid cell indices:
   double x = 0, y = 0;
    int k = 0;
    for (int i = 0; i < 10; i++)
    {
      x = 1;
      y += 1;
      for (int j = 0; j < 10; j++)
      {
       x += 1;

       series.XValues.Add(x);
       series.Values.Add(y);
       series.X2Values.Add(i);
       series.Y2Values.Add(j);
       series.BorderStyles[k] = new NStrokeStyle(1, Color.Black);
       k++;
      }
    }

this produces the following image:


which is correct. Can you try to check if you still experience the problem with the most recent version?


Best Regards,
Nevron Support Team


Similar Topics


Reading This Topic