Profile Picture

Date Formatting

Posted By Greg Corliss 9 Years Ago
Author
Message
Greg Corliss
Problem Posted 9 Years Ago
View Quick Profile
Forum Newbie

Forum Newbie (0 reputation)Forum Newbie (0 reputation)Forum Newbie (0 reputation)Forum Newbie (0 reputation)Forum Newbie (0 reputation)Forum Newbie (0 reputation)Forum Newbie (0 reputation)Forum Newbie (0 reputation)Forum Newbie (0 reputation)

Group: Forum Members
Last Active: 9 Years Ago
Posts: 9, Visits: 17
I have created a stacked bar chart from a SharePoint List View.
My dates show up as 1/1/1900 12:00 AM. I just want the month to show as JAN.
I've gone into Chart Areas > Axes > Primary X > Scale and set the sub Type to Date Time and Formatting to Fixed and set the Label format to MMM and nothing changes.
I've also tried setting the Label Angle and step mode set to a custom one month step to no avail.
Below is how I have it set up:

https://www.nevron.com/forum/uploads/images/bddbc18e-29e4-4908-9f4c-f518.jpg


Nevron Support
Posted 9 Years Ago
View Quick Profile
Supreme Being

Supreme Being (4,329 reputation)Supreme Being (4,329 reputation)Supreme Being (4,329 reputation)Supreme Being (4,329 reputation)Supreme Being (4,329 reputation)Supreme Being (4,329 reputation)Supreme Being (4,329 reputation)Supreme Being (4,329 reputation)Supreme Being (4,329 reputation)

Group: Forum Members
Last Active: Last Year
Posts: 3,039, Visits: 3,746
Hi Greg,
You are probably using a Bar chart with Stacked sub type and the chart uses Categorical X-axis.
You need to switch to XY Scatter Stacked sub type and then pass the date-time field for the Value Groupings X value (under Pivot -> Data Groupings -> Values -> General -> Data tab).

The chart will now be using Numeric Scale - you can change the Sub type to Date Time and configure the date time formatting.

Hopefully this helps.


Best Regards,
Nevron Support Team


Greg Corliss
Posted 9 Years Ago
View Quick Profile
Forum Newbie

Forum Newbie (0 reputation)Forum Newbie (0 reputation)Forum Newbie (0 reputation)Forum Newbie (0 reputation)Forum Newbie (0 reputation)Forum Newbie (0 reputation)Forum Newbie (0 reputation)Forum Newbie (0 reputation)Forum Newbie (0 reputation)

Group: Forum Members
Last Active: 9 Years Ago
Posts: 9, Visits: 17
You were correct. I was using a Bar Chart, Stacked Sub Type with a Categorical X Axis.

I changed it to the XY Scatter Stacked, Added the Date Field to the X Groupings for Value 0 (Not available in any other of the values, assuming that that one is used for all).
Set the Primary X axes Scale mode to Numeric then in Scale set the Sub Type to Date / Time, Formatting Mode fixed with the Lable format of MMM. And I now get a chart with the Month label on the bottom but no data.
I am using a list view filtered to show only 2015 values (I figured I'd fight the Range issue later, simply adding a start and end date in a date format or numerical (Days since 1/1/1900) format doesn't seem to work).
This is what it now looks like.


The data spans 1/2015 - 8/2015 yet it only shows Dec and Jan with no data. Not sure where I 'm going wrong here.
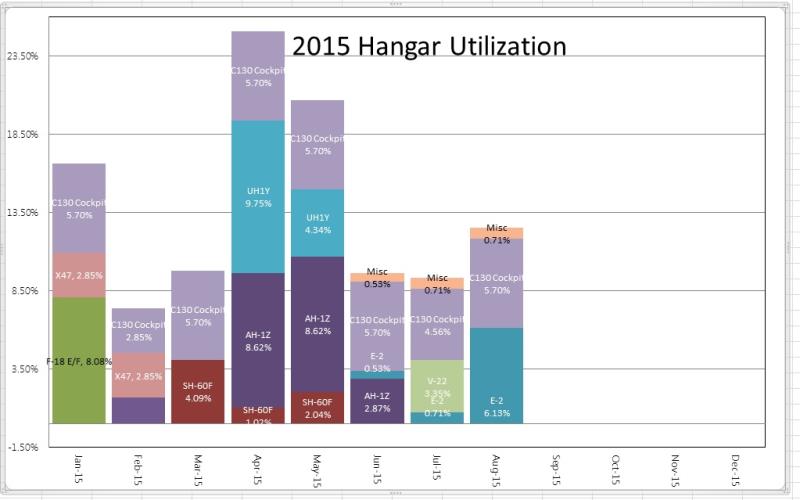
My Goal is to get something like this which I did in excel.


I've attached what I THINK is the relevant settings I'm using in a word doc.


Nevron Support
Posted 9 Years Ago
View Quick Profile
Supreme Being

Supreme Being (4,329 reputation)Supreme Being (4,329 reputation)Supreme Being (4,329 reputation)Supreme Being (4,329 reputation)Supreme Being (4,329 reputation)Supreme Being (4,329 reputation)Supreme Being (4,329 reputation)Supreme Being (4,329 reputation)Supreme Being (4,329 reputation)

Group: Forum Members
Last Active: Last Year
Posts: 3,039, Visits: 3,746
Hi Greg,
There was no DOC file with your post.
Can you send us a screenshot of the Data Preview in the Designer -> Data Source tab?
You can also send us a template of your existing chart (save the .NCSP template file from the Designer).


Best Regards,
Nevron Support Team


Greg Corliss
Posted 9 Years Ago
View Quick Profile
Forum Newbie

Forum Newbie (0 reputation)Forum Newbie (0 reputation)Forum Newbie (0 reputation)Forum Newbie (0 reputation)Forum Newbie (0 reputation)Forum Newbie (0 reputation)Forum Newbie (0 reputation)Forum Newbie (0 reputation)Forum Newbie (0 reputation)

Group: Forum Members
Last Active: 9 Years Ago
Posts: 9, Visits: 17
https://www.nevron.com/forum/uploads/images/8136cd73-88fe-4b1d-a3e3-36fa.jpg

Attachments
chartsettings.pdf (708 views, 218.00 KB)
Nevron Support
Posted 9 Years Ago
View Quick Profile
Supreme Being

Supreme Being (4,329 reputation)Supreme Being (4,329 reputation)Supreme Being (4,329 reputation)Supreme Being (4,329 reputation)Supreme Being (4,329 reputation)Supreme Being (4,329 reputation)Supreme Being (4,329 reputation)Supreme Being (4,329 reputation)Supreme Being (4,329 reputation)

Group: Forum Members
Last Active: Last Year
Posts: 3,039, Visits: 3,746
Hello Greg,
All expressions should start with the equal sign "="
You should update the expressions for the X value and the Label.

Let us know if this helps.


Best Regards,
Nevron Support Team


Greg Corliss
Posted 9 Years Ago
View Quick Profile
Forum Newbie

Forum Newbie (0 reputation)Forum Newbie (0 reputation)Forum Newbie (0 reputation)Forum Newbie (0 reputation)Forum Newbie (0 reputation)Forum Newbie (0 reputation)Forum Newbie (0 reputation)Forum Newbie (0 reputation)Forum Newbie (0 reputation)

Group: Forum Members
Last Active: 9 Years Ago
Posts: 9, Visits: 17
That seemed to fix it. Thanks.
One last question, How do you convert a decimal to a percentage value on the axes and data labels?
I've tried numerous things, looked at the documentation and just can't seem to figure it out.


Nevron Support
Posted 9 Years Ago
View Quick Profile
Supreme Being

Supreme Being (4,329 reputation)Supreme Being (4,329 reputation)Supreme Being (4,329 reputation)Supreme Being (4,329 reputation)Supreme Being (4,329 reputation)Supreme Being (4,329 reputation)Supreme Being (4,329 reputation)Supreme Being (4,329 reputation)Supreme Being (4,329 reputation)

Group: Forum Members
Last Active: Last Year
Posts: 3,039, Visits: 3,746
Hi Greg,
You can review the following example: Stacked Bar Chart

Hopefully this helps.
Let us know if you meet any problems or if you have questions.


Best Regards,
Nevron Support Team


Greg Corliss
Posted 9 Years Ago
View Quick Profile
Forum Newbie

Forum Newbie (0 reputation)Forum Newbie (0 reputation)Forum Newbie (0 reputation)Forum Newbie (0 reputation)Forum Newbie (0 reputation)Forum Newbie (0 reputation)Forum Newbie (0 reputation)Forum Newbie (0 reputation)Forum Newbie (0 reputation)

Group: Forum Members
Last Active: 9 Years Ago
Posts: 9, Visits: 17
I've already looked at that. It shows how to change the chart type based on the parameter of the connected webpart which converts it to a stacked percent.
I simply want the 0 - 1 on the Y axis to display 0% to 100%. The stacked percent is not what I want.
It has something to do with the Label format I believe. Think it would be straight forward and simple.
I've read through the documentation, looked at numerous examples, I am unable to locate an example that does what I'm asking or documentation explaining how to accomplish it.


Greg Corliss
Posted 9 Years Ago
View Quick Profile
Forum Newbie

Forum Newbie (0 reputation)Forum Newbie (0 reputation)Forum Newbie (0 reputation)Forum Newbie (0 reputation)Forum Newbie (0 reputation)Forum Newbie (0 reputation)Forum Newbie (0 reputation)Forum Newbie (0 reputation)Forum Newbie (0 reputation)

Group: Forum Members
Last Active: 9 Years Ago
Posts: 9, Visits: 17
I figured it out. Reading through the documentation for numerical Formatting. All I had to do was put a P (without any quotes) in The Label format and it converted it to a percentage.

Thanks for all the help.


Similar Topics


Reading This Topic