Working with Nevron Chart for .NET - Surface Charts

Working with Nevron Chart for .NET - Surface Charts

Introduction

A Surface Chart is a 3D representation of a set of points that produces a filled area in 3D where each set of three distinct, adjacent data points forms a triangle. Surface charts also commonly combine the three-dimensional filled area representation with functionality to visualize the surface mesh and the intersections of the surface with planes that slice the surface along one of its dimensions. The lines produced by those intersections are referred to as contour lines or isolines. Further, surface charts usually support various ways to color the surface and contour lines. This article briefly discusses the functionality of Nevron Chart for .NET that allows the user to display multiple types of surface charts.

Features

Fig 1

Fig.1

Nevron Chart for .NET supports four types of surface charts that differ in how data is passed to the control. Those are the grid surface, mesh surface, triangulated surface, and vertex surface chart types. They all share common functionality regarding the displayed filling, contour lines, and support for hit testing. All surface charts support rendering with or without GPU acceleration on various platforms such as WPF, WinForms, and ASP.NET.

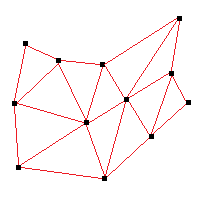
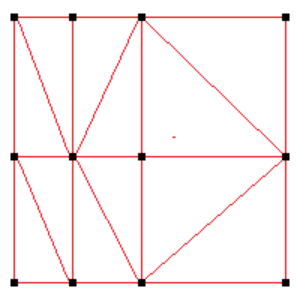
Let’s first look at how data is organized with each of those surface charts starting with the grid surface. In this surface chart, data is organized in a regularly or irregularly spaced grid along the X/Y plane, where all points that lie on the same row or column share the same y and x coordinate, respectively. The picture on Fig.1 shows how the control will split the data in an irregular grid surface series into distinct triangles::


Fig 2

Fig.2

Note that the control can choose between connecting the top left and bottom right vertex or the top right and bottom left vertex. This is configurable, and you have options to force the control always to pick one or the other diagonal or choose based on the elevation of the vertexes.

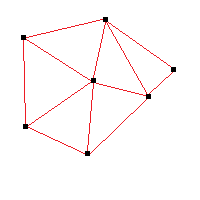
Similarly, a mesh surface series is also represented by a grid of three-dimensional points, the difference being that each point can have different X/Y coordinates, as illustrated in Fig.2.

Fig 3

Fig.3

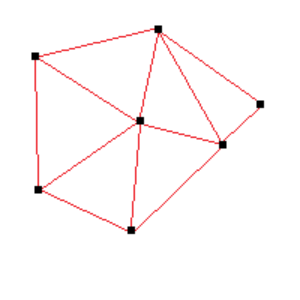
The mesh can also pick between the left top / right bottom and right top / left bottom, like the grid surface series.

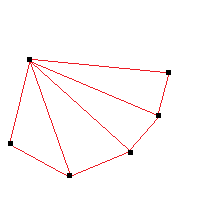
Next, there is the triangulated surface series. The input data for this surface series can be an arbitrary set of points in 3D. The control will create a Delaunay triangular mesh based on this set. For example:


Fig 4

Fig.4

The image from Fig.3 shows how the triangulated mesh looks when looked at from the top. The Delaunay triangulation is characterized by each set of arbitrary 3D points having only one Delaunay triangulation. Further, this triangulation guarantees that the produced triangles are maximally equilateral and non-interesting

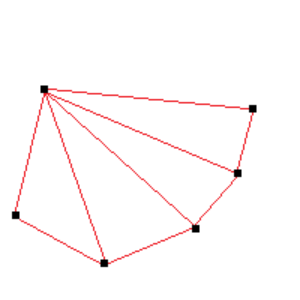
Finally, there is the vertex surface series which accepts a set of points and a vertex primitive. For example, the following image illustrates a vertex surface series with six points and a triangle fan vertex primitive. The triangle fan center point is located at the top left corner of the image:

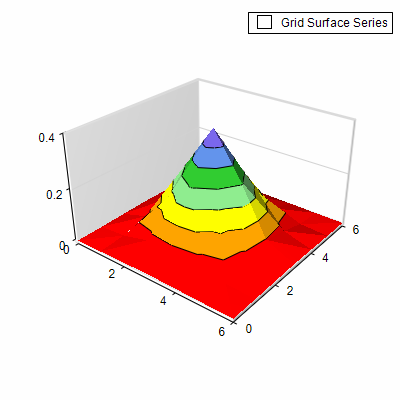
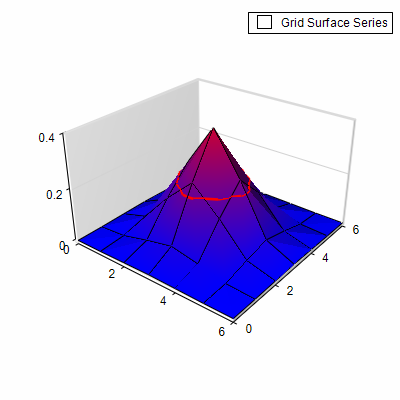
After we’ve covered the basics, let’s look at some C# code showing how to display the standard normal distribution function along the x/y plane as a 3D surface chart. In its most simple form, the code will look like this:

// configure chart to display 3D
NChart chart = nChartControl1.Charts[0];
chart.Width = chart.Depth = 50;
chart.Height = 30;
chart.BoundsMode = BoundsMode.Fit;
chart.Enable3D = true;
chart.Axis(StandardAxis.PrimaryX).ScaleConfigurator = new NLinearScaleConfigurator();
chart.Axis(StandardAxis.Depth).ScaleConfigurator = new NLinearScaleConfigurator();
chart.Projection.SetPredefinedProjection(PredefinedProjection.PerspectiveTilted);

// add grid surface
NGridSurfaceSeries surfaceSeries = new NGridSurfaceSeries();
chart.Series.Add(surfaceSeries);

// add dummy data
int gridSize = 3;
surfaceSeries.Data.SetSize(gridSize * 2 + 1, gridSize * 2 + 1);
surfaceSeries.Data.UseColors = false;

for (int x = -gridSize; x <= gridSize; x++)
{
for (int y = -gridSize; y <= gridSize; y++)
{
double distance = Math.Sqrt(x * x + y * y);
double elevation = (1 / Math.Sqrt(2 * Math.PI)) * Math.Exp(-distance * distance / 2);
surfaceSeries.Data.SetValue(x + gridSize, y + gridSize, elevation);
} }
Surface Chart

Fig.5

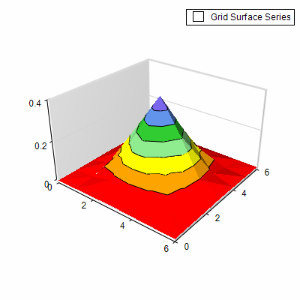
This code will produce the following surface:

Suppose that you want to change the color palette associated with the surface to something different – for example, shades of red to green that map blue to zero values and red to 0.5 – the code to do this is:

Gird Surfice Blue

Fig.6

Suppose that you want to change the color palette associated with the surface to something different – for example, shades of red to green that map blue to zero values and red to 0.5 – the code to do this is:


surfaceSeries.Palette.Mode = PaletteMode.Custom;
surfaceSeries.Palette.Clear();
surfaceSeries.Palette.SmoothPalette = true;
surfaceSeries.Palette.Add(0, Color.Blue);
surfaceSeries.Palette.Add(0.5, Color.Red);
surfaceSeries.Palette.Mode = PaletteMode.Custom;
surfaceSeries.Palette.Clear();
surfaceSeries.Palette.SmoothPalette = true;
surfaceSeries.Palette.Add(0, Color.Blue);
surfaceSeries.Palette.Add(0.5, Color.Red);

Chart Isolines

Fig.7

Next, suppose we want to mark the value of 0.2 on this surface. For this purpose, we can use an isoline:

surfaceSeries.Isolines.Add(new NSurfaceIsoline(0.2, new NStrokeStyle(2, Color.Red)));

Fig 8

Fig.8

And display the triangle mesh:

surfaceSeries.FrameMode = SurfaceFrameMode.Mesh;

Conclusion

This article only scratches what is possible with the surface functionality present in Nevron Chart for .NET. The control supports numerous fill and frame rendering options, support for real-time, shader-based rendering of all surface charts that offloads the CPU from all calculations and transfers the load to the GPU, options for skipping empty data points, clipping planes, and others. We strongly recommend you download the fully functional and free evaluation version of Nevron .NET Vision for a complete list and description of the features and ready code examples.

About Nevron Software

Founded in 1998, Nevron Software is a component vendor specialized in the development of premium presentation layer solutions for .NET based technologies. Today Nevron has established itself as the trusted partner worldwide for use in .NET LOB applications, SharePoint portals and Reporting solutions. Nevron technology is used by many Fortune 500 companies, large financial institutions, global IT consultancies, academic institutions, governments and non-profits.
For more information, visit: www.nevron.com.
  
The quality of the graphics we produce with Nevron Chart greatly impresses everyone. While the software development department in our startup company consists of only five people, the fact that we can produce world-class graphics goes a long way towards convincing potential clients of our professionalism.

I like to lead off the demonstrations that I provide for customers with one or more of the plots I generate with Nevron Chart. The quality of these graphics is so obvious and so arresting that they grab everyone's attention, and make sure that the people in the room are going to listen to whatever I have to say next.

The Nevron Chart software is absolutely central to our software development efforts. The data analysis package that we've written uses graphics to tell the stories that lies behind the data, and the precision and user interactivity that we can achieve with the Nevron package enable us to tell those stories in a very compelling fashion.

We have been using Nevron Chart as a central element in our software development efforts for the last three years, and we have no desire to switch to any other package. I've been consistently impressed with the robustness of the code, the range of the capabilities, and above all with the quality of the graphics since the time that I first started experimenting with this package. Graphical presentations have been a part of my scientific programming efforts for the last 20 years, and as far as I'm concerned there is no other package on the market that is better than Nevron Chart.
  

Benjamin Alexander
BioProcessors