Nevron Logo

Nevron Chart for SharePoint

Nevron Chart for SharePoint

The most advanced chart web part available for WSS3.0, SharePoint 2007, 2010, 2013, 2016, and 2019.

Nevron Chart for SharePoint

The most advanced chart web part available for WSS3.0, SharePoint 2007, 2010, 2013, 2016, and 2019.

Sharepoint pie chartSharepoint twin bar chartSharepoint bar chart
About
Chart Types
Axes
Configuration
Miscellaneous

Nevron Chart for SharePoint
Deliver Advanced Charts inside any SharePoint page

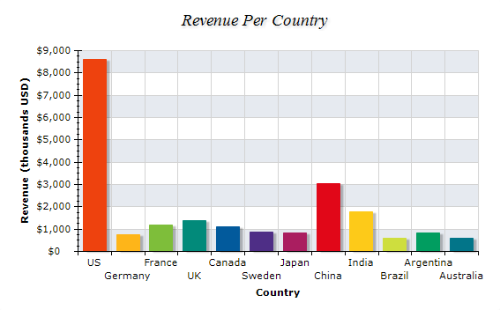
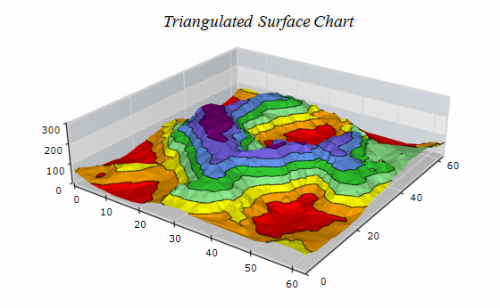
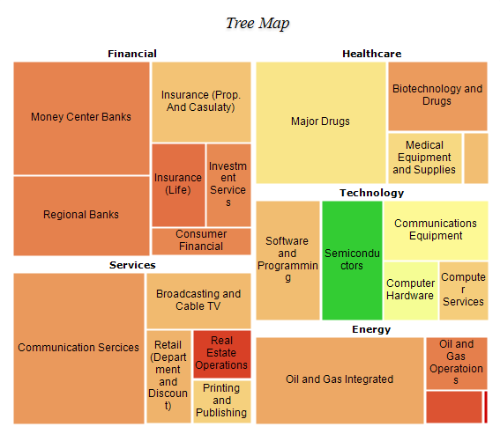
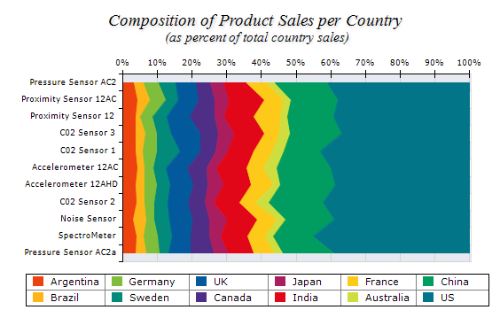
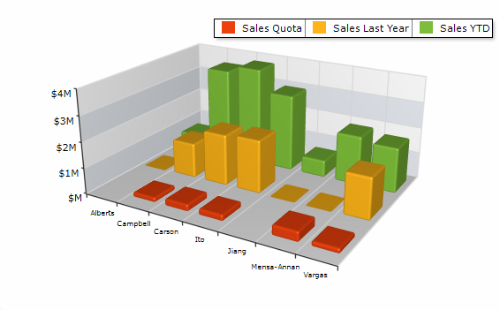
Nevron Chart for SharePoint is an advanced web part that delivers a complete and unmatched set of 2D and 3D charting types, highly customizable axes, advanced data analysis, numerous tuning options, and stunning visual effects to your SharePoint sites.

It combines the industry-leading Nevron Charting engine for ASP.NET with the powerful Nevron Pivot Data Aggregation engine. This allows for virtually any SharePoint user to visually create advanced pivot charts with truly unique and impressive looks. That is why it is considered to be the Microsoft Excel Pivot Chart analog in the SharePoint context.

Nevron Chart for SharePoint features:
- Seamless integration in WSS3.0, SharePoint 2007, 2010, 2013, 2016, and 2019
- Superior set of 2D/3D charting types
- Unique pivot charting capabilities
- Web-based configuration interface
- Binding to diverse data sources

Customer Quotes:

QUOTE Nevron Vision for SharePoint provides us with a fully featured chart design tool, flexible and easy to use data connectors and a simple cost effective licensing model. These combined features have enabled our developers to quickly and efficiently create a wide range of charts from MS SQL views to SharePoint lists. The Nevron Vision for SharePoint feature set has enabled our company to produce all required charts in-house, reducing development costs and providing us with a quick ROI. UNQUOTE

Paul Savvides, System Assistant
Saudi Petroleum Overseas Ltd.