Nevron Logo

Why Choose Nevron Chart for .NET?

With so many charting controls on the market choosing the right one that fits your requirements and budget can be a difficult task. You need to compare a lot of vendors with different technologies and capabilities in data visualization, different licensing models and different pricing. In this page we outline the top ten reasons why Nevron Chart is the preferred solution for thousands of developers and companies around the globe.


Complete

Why Choose Complete

Nevron Chart is the complete solution to your business, presentational, scientific and BI charting needs. Whether you need 2D or 3D charting or gauges, this component will deliver the right set of features.

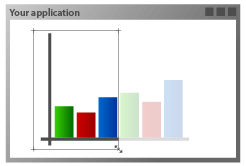
The component includes a full set of charting types including Bar, Line, Step Line, Area, Pie, Point, Bubble, Stock, Floating Bar, Radar, Polar, High Low, Mesh Surface, Grid Surface, Shape, Smooth Line, Float Bar, Venn and Error with many variations (such as Scatter XY and XYZ Line, Stacked Bars etc.). It also features many extensions such as financial and statistical formulas, gauges, legends, watermarks, labels and much more.

Scalable

Why Choose Scalable

Nevron Chart has been designed to scale to your requirements. This scalability is reflected in the design of the component object model. Whether you build a small or an enterprise charting enabled application this component can meet your requirements, and the licensing model closely follows the features that you use.

Efficient and Fast

Why Choose Fast and efficient

Nevron Chart for .NET is one of the fastest charting tools for the .NET platform. The component has been optimized to perform well and use a minimal set of GDI+ / OpenGL resources.

Easily Licensed

Why Choose Easily licensed

Nevron Chart's licensing model is simple and there are no catches. It is easy to comprehend and is also upgradeable - simply put, we charge per developer seat, depending on the features you use. If you decide to use more, you can always upgrade. No royalties for redistribution of desktop applications and cost-effective OEM program for deployments to production web servers.

Supported

Why Choose Supported

We take great pride in our support, which is based on a direct contact with the people that developed this component for you. You can expect the highest level of professionalism and service, backed with our 24 hour response policy.

Customizable

Why Choose Customizable

Every aspect of the control behavior is programmable and customizable. You can custom program the component axes or intercept painting events to alter the default chart painting with ease.

Innovative

Why Choose Innovative

Nevron Chart is a product of our company's long record of innovation and attention to detail. The component delivers unique features, not present in any other charting solution.

Editable

Why Choose Editable

You can visually edit every property of the component using the built in Chart Editor at design time or at run time.

Serializable

Why Choose Serializable

The component is fully serializable in both binary and XML formats. You can as well import state from the Windows Forms control to Web Forms and vice versa.

Documented

Why Choose Documented

Nevron Chart for .NET is shipped with MSDN style Users Guide, Programmers Reference and a set of 400+ examples for Windows Forms and Web Forms that show every aspect of the development, based on this charting solution. Whether you need a simple chart or elaborated dashboard you will find the right example.

Customer Quotes:

QUOTE Charting is a core piece of functionality in our upcoming product line. It was difficult for us to trust such a key feature to a third party, however, after trying Nevron Chart for .NET that fear has long subsided and we're continually impressed by what this package can do. UNQUOTE

Bill Buchanan, V.P. of Software Development
Yye Software