Nevron Logo

Nevron Chart for WinForms

Nevron Chart for WinForms

The industry leading .NET charting component for WinForms desktop applications.


An advanced solution for any Business Intelligence, Financial or Scientific application.

Nevron Chart for WinForms

The industry leading .NET charting component for WinForms desktop applications.

An advanced solution for any Business Intelligence, Financial or Scientific application.

Large surface chartReal time radar chartReal time bar chart

Nevron Chart for WinForms
Advanced data visualization and real-time charting for Windows Forms applications

Nevron WinForms Chart sets the standards for WinForms charting controls by delivering advanced charting features, rich interactivity features coupled with unmatched performance and impressive visual looks.

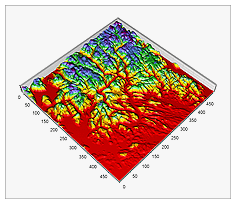
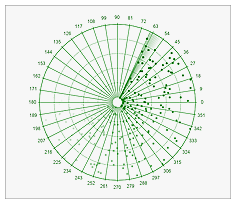
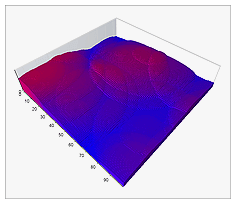
The WinForms Chart component supports virtually all 2D and 3D charting types and is suitable for a wide range of applications including business, scientific, statistical, financial, real time monitoring, measurement, BI and others. In addition it also allows for the visualization of instrumentation panels, such as Linear and Radial Gauges, numeric displays and state indicators, making it suitable for the display of KPI’s or the creation of digital dashboards.

Some of the key WinForms related features of the control are:

  • Ability to leverage the video board hardware acceleration. The control delivers unmatched performance and is suitable for a wide range of real time monitoring and other performance critical applications.

  • Unmatched interactivity features – the control supports interactive data zooming, data panning, data stepping, data scrolling, tooltips, hit testing and others.

  • Build in UI components and visual editors – chart editor, chart wizard, chart toolbar and chart grid are included in the win forms edition of the control.

  • Advanced built-in printing and print - preview support.

Customer Quotes:

QUOTE After struggling with the limitations of a competitor product, we did a thorough evaluation of over 15 different charting components for Windows Forms. In terms of visual appearance, features, and design, Nevron Chart for .Net is clearly superior to every other product we tried, particularly for 3D surface functionality. The design of this component reflects a rare talent for graphic design and user interfaces, which I think will be quite difficult for competitors to imitate. Moreover, the Nevron support team was very knowledgeable and provided quick answers to our questions.

Between you and me, I think your ordering system needs a little work, but I would have hammered my credit card into a tree stump if that's what it took to get our hands on this product. It really is the best charting component in existence. ;-)

Thanks!
UNQUOTE

Pete Gonzalez, V.P. of Development
Bluel Technologies