Nevron Logo

Nevron Chart for WPF

Nevron Chart for WPF

The industry leading .NET charting component available for WPF.


Ever wondered if you can have advanced data visualization and fast real-time charting in your WPF applications?

Nevron Chart for WPF

The industry leading .NET charting component available for WPF.

Ever wondered if you can have advanced data visualization and fast real-time charting in your WPF applications?

3D float bar chartRadial gauge whiteCustom painting bar chart

Nevron Chart for WPF
Advanced data visualization and real-time charting for WPF applications

Nevron WPF Chart sets the standards in WPF charting by delivering industry leading charting feature set, performance, rich interactivity features and impressive visual looks.

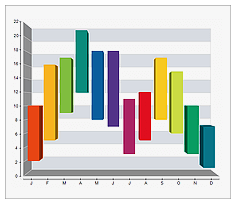
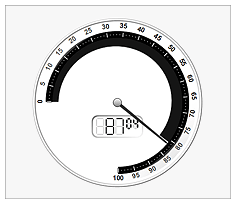
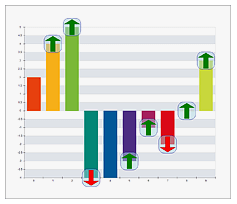
The WPF Chart component supports virtually all 2D and 3D charting types and is suitable for a wide range of applications including business, scientific, statistical, financial, real time monitoring, measurement, BI and others. In addition it also allows for the visualization of instrumentation panels, such as Linear and Radial Gauges, numeric displays and state indicators, making it suitable for the display of KPI’s or the creation of digital dashboards.

Some of the key features of the WPF Chart control are:

  • Ability to leverage the video board hardware acceleration. The control delivers unmatched performance and is suitable for a wide range of real time monitoring and other performance critical applications.

  • Unmatched interactivity features – the control supports interactive data zooming, data panning, data stepping, data scrolling, tooltips, hit testing and others.

Customer Quotes:

QUOTE We are using Nevron Chart in our new generation of instruments. Nevron Chart enabled us to produce stunning new graphics with highly detailed information for our clients. Everyone we have spoken with about our graphics presentation has been impressed with our results! UNQUOTE

Patricio Vidal, Ph.D.
Beckman Coulter, Inc.