Data visualization is crucial for effective data analysis and interpretation. One way to enhance data visualization is using marker shapes for 2D objects. This section explores the different marker shapes available in the Nevron charting tool and their potential applications.
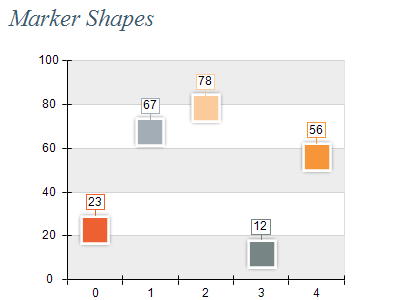
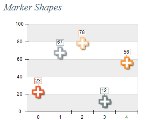
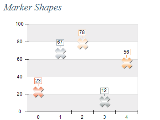
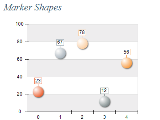
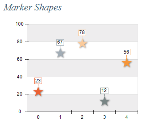
Marker shapes are small symbols or icons representing data points on a chart or graph. They can draw attention to specific data points, highlight trends or patterns in data, or distinguish different data types.
Using the appropriate marker shape is essential for improving the clarity and impact of your data presentations. The different marker shapes offer a wide range of options for highlighting trends, distinguishing different data types, and drawing attention to specific data points. It is critical to understand the strengths and limitations of each marker shape to utilize them in data visualization effectively.