|
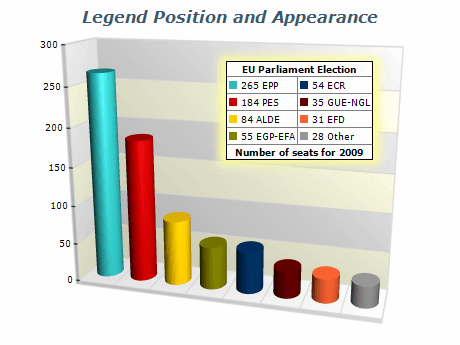 | The example demonstrates the built-in functionality of the integrated legend to be positioned at an arbitrary place in the control window as well as to customize the legend appearance like grid lines, font, header, footer, glow, shadow etc. |
|
|
The example demonstrates the ability to interlace the legend horizontally and vertically - here using gray gradient interlace style. |  |
|
|
 | This example demonstrates the ability to assign legends to series. A separate legend can be assigned to each series. In this example the stacked bar chart contains three bar series, one of which is displayed on one legend and the other two series are displayed on another legend. |
|
|
Legends in Nevron Chart can be docked in chart panels, in the root panel or in any other panel. The user can control the docking position, determine the docking panel, control bounds mode (like stretch or fit), content alignment and expansion mode (rows, columns etc.) of the legend. | 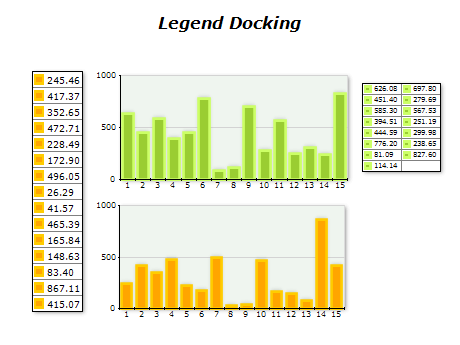 |
|
|
 | Mark Shapes can be selected and customized for better readability. |
|
|


