Announcing Nevron Vision for .NET 2016.1
Wilmington, Delaware — Apr 18, 2016
Announcing Nevron Vision for .NET 2016.1 – the best component suite for .NET data visualization!
Nevron Vision for .NET 2016.1 comes with a major upgrade of Nevron Chart for .NET and Nevron Map for .NET, as well as many improvements in Nevron UI for .NET. Adding several new charting types, palette filling for the area, bar, float bar, high low and smooth area series, table scale and many more features and improvements is making it the absolute ultimate choice for creating advanced dashboards for WinForms, WPF, ASP.NET and MVC applications.
Following is a list of the most important updates in Nevron Chart for .NET (for the full list of updates, please refer to the Documentation).
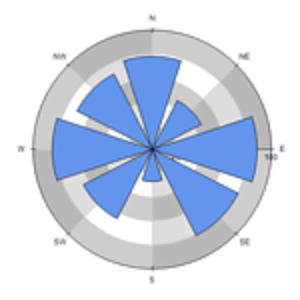
The Polar Range series displays ranges in a polar coordinate system. Each range is specified by its begin and end values and its begin and end angle.
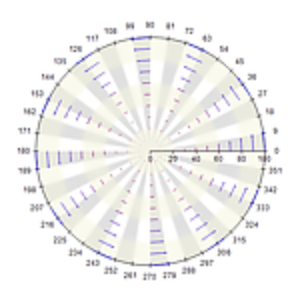
The Polar Vector series displays vectors in a polar coordinate system. Each vector is specified by its begin and end values and its begin and end angle.
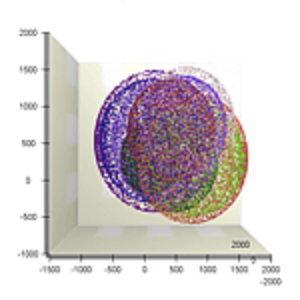
The Quick Point series can display massive amounts of data - it has a reduced features set compared the standard Point Series, however it is much faster in both 2D and 3D.
The Area, Bar, Float Bar, High Low and Smooth Area Series now can have their filling specified as a user defined color / value palette. This feature is supported in both 2D and 3D charts.
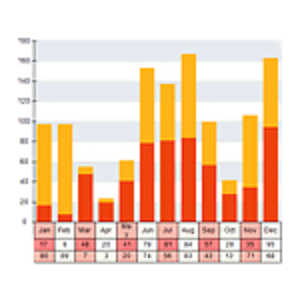
The Table Scale is a new type of scale that allows the visualization of tables attached to chart axes. This feature is commonly used to annotate the X axis of categorical stacked or cluster charts.
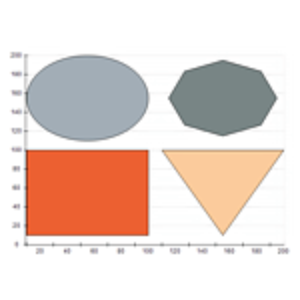
The Graphics Path Series displays can display an arbitrary figure defined by lines and bezier segments.
The Radar Axis Anchors has been extended to allow custom angle position for the radar axis.
The new version comes with many improvements such as better WPF integration, speed improvement in the Triangulated Surface series, extension of the Heat Map functionalities for rendering of contour lines and an additional ability to get the xy values for Kagi, Renko and Three Line Break charts.
Timer Clock Mode
Analog and digital clocks support a new mode called "Timer" that allows for the display of time spans (not only date time).
-
Refined and improved API for working with maps, map data and ESRI shapefiles
-
Improved rendering of map arcs (i.e. parallels and meridians)
-
Additional properties for configuring the appearance of map arcs and their labels
-
Improved rendering of map labels
-
Ability to change the appearance of the map labels without reimporting the map
-
Improved polygon labelling algorithm, which results in nicer labeling of map polygon features like countries, states, lakes, etc.
-
Ability to choose the method to use for polygon labeling, the options being: BoundsCenter, Centroid and Optimal
-
Improved Orthographic map projection
-
Improved map data binding API
-
Performance improvements in map import and data binding
The best way to understand the power of Nevron Vision for .NET is to test it yourself. This is why we provide a
fully functional 60 days free evaluation with no obligations whatsoever.
Founded in 1998, Nevron Software is a component vendor specialized in the development of premium presentation layer solutions for .NET based technologies.
Today Nevron has established itself as the trusted partner worldwide for use in .NET LOB applications, SharePoint portals and Reporting solutions.
Nevron technology is used by many Fortune 500 companies, large financial institutions, global IT consultancies, academic institutions, governments and non-profits.

 Open Vision for .NET
 NOV Chart for .NET
 NOV Diagram for .NET
 NOV Rich Text Editor for .NET
 NOV Grid for .NET
 NOV Schedule for .NET
 NOV Gauge for .NET
 NOV Barcode for .NET
 NOV User Interface for .NET
 Vision for .NET
 Chart for .NET
 Diagram for .NET
 User Interface for .NET
 Vision for SSRS
 Chart for SSRS
 Gauge for SSRS
 Map for SSRS
 Barcode for SSRS
 Vision for SharePoint
 Chart for SharePoint
 Gauge for SharePoint
 Map for SharePoint
 Barcode for SharePoint