Wilmington, Delaware — Oct 24, 2018
Nevron Software announces the official release of Nevron Vision for .NET 2018.1 – the leading component suite for .NET data visualization!
The new release introduces great new features in Nevron Chart for .NET to extend the data visualization capabilities of the most advanced .NET charting component.
Following is a summary of the new features introduced by the 2018.1 release:
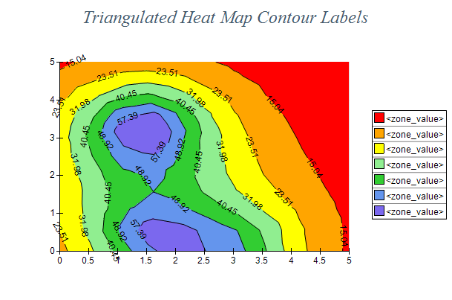
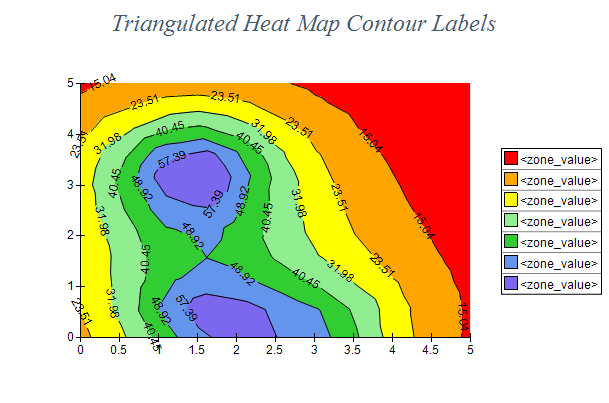
The Triangulated Heat Map Series adds support for drawing triangulated meshes of arbitrary XYZ points. The X/Y coordinates of the point are used to determine the point location on the X and Y axes whereas the Z coordinate is used to specify the point elevation. The series also support contour with configurable stroke and label style.
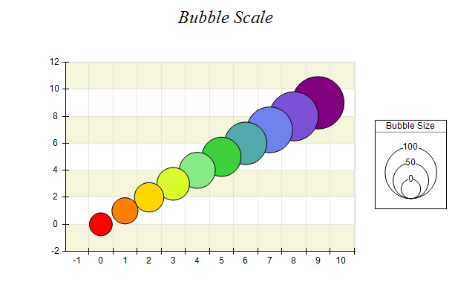
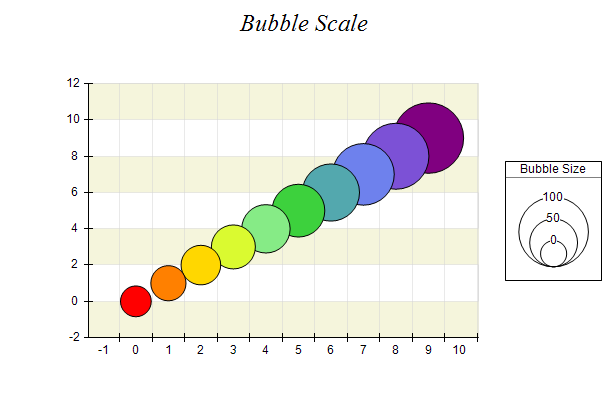
The Bubble Serries adds support for bubble size scale - this is a legend mode which shows a map of different bubble sizes and their values. This feature is useful when you want to show how different bubble sizes translate to the bubble size value.
The Bubble Series adds support for Bubble Palette - this is a pallete object which can be attached to the bubble series and defines coloring for the bubbles depending on their size.
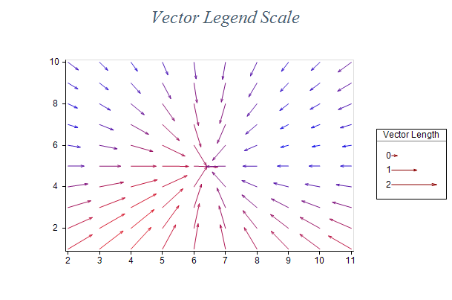
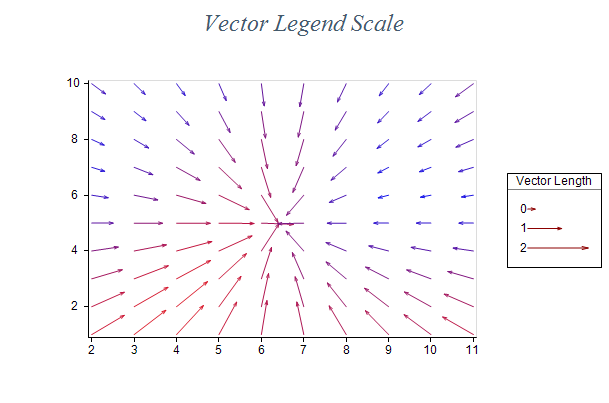
The Vector Series adds support for vector size scale - this is a legend mode which shows a map of different vector sizes and their values. This feature is useful when you want to show how different vector lengths translate to the vector length. In addition the Vector Series adds support for a special drawing mode which allows you to scale vector lengths - this allows you to plot vectors with small lengths.
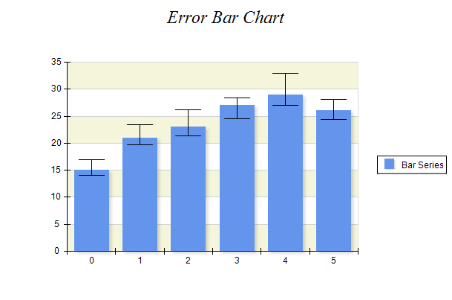
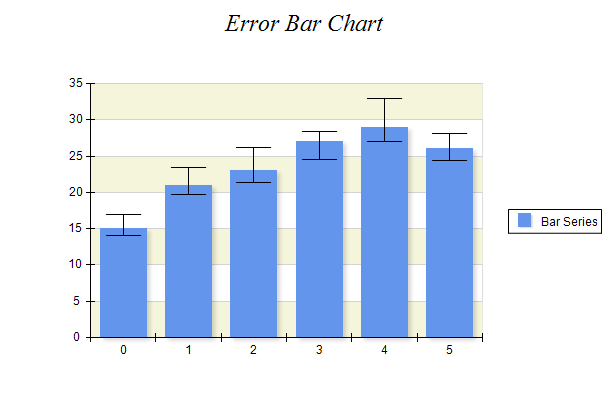
The Bar Series adds support for error bars and control over the bars pixel snapping (EnableXPixelSnapping and EnableYPixelSnapping properties).
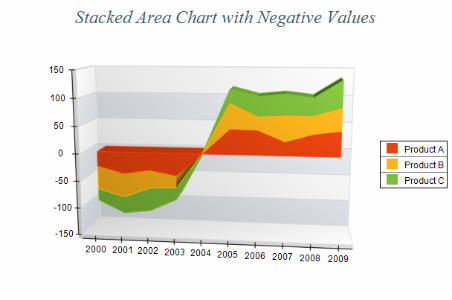
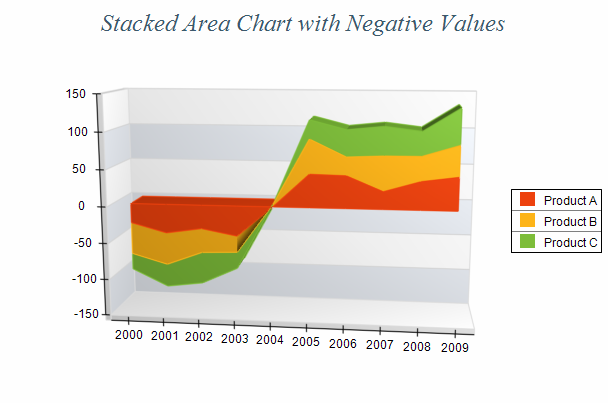
The Stacked Area Series now supports negative values (AllowNegativeStackValues property).
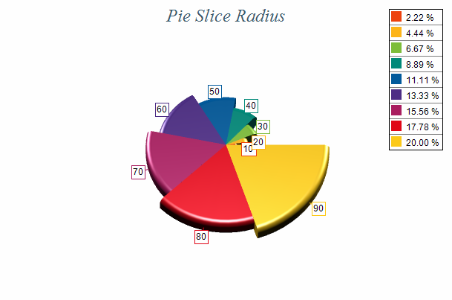
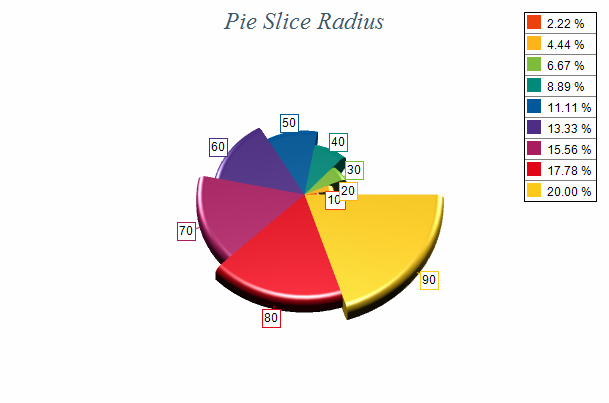
Added feature to control the width of pie segments per segment - BeginWidthPercent and EndWidthPercent.
All cartesian series now support a feature to control whether the series regards the axis clipping options.
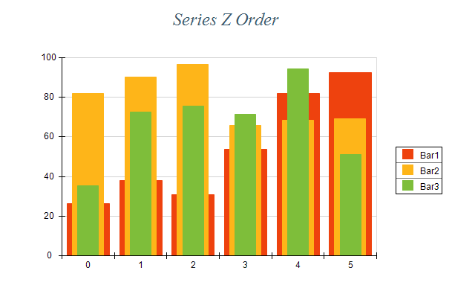
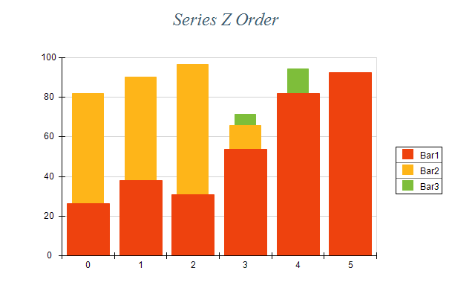
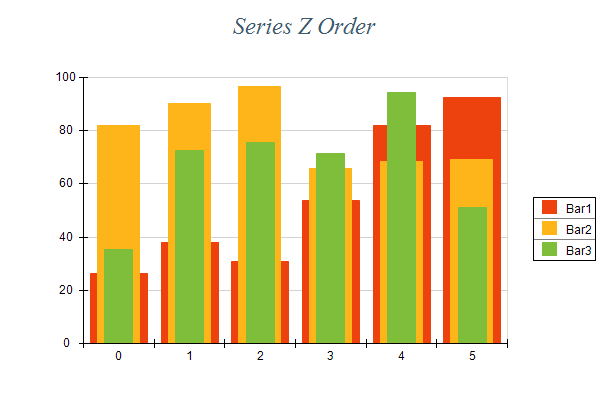
All cartesian series now support the Z order property which allows you to specify the drawing order of the series without moving it in the series collection.
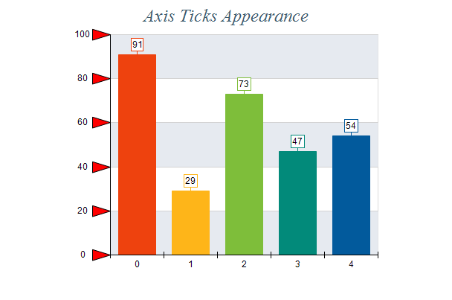
Added feature to specify that scale decorations (ticks, labels etc.) should be rendered in front or back of the back chart wall.
Added feature to control how axis labels fit inside the chart panel bounds. You can select whether to regard the axis height, height and width or to automatically select the best mode.
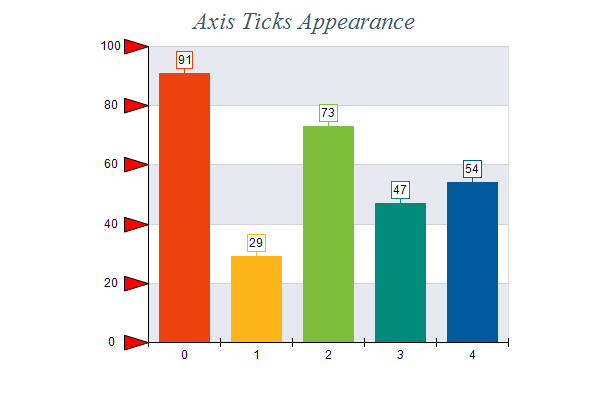
Added control over the tick shape for cartesian scales.
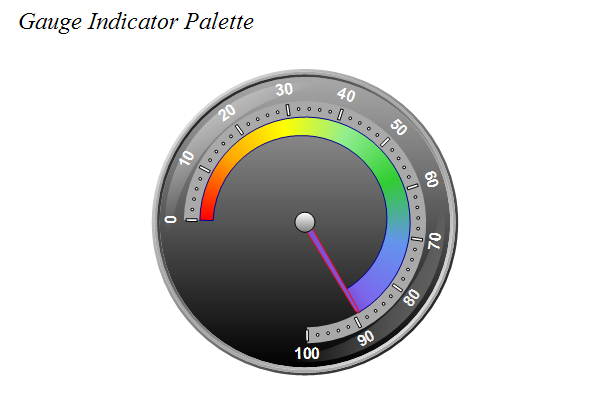
Linear and Radial gauge indicator support a palette object. The palette can either spread over the indicator or the current indicator palette value can be used to color the indicator.
Optimizerd chart min max calculations and cache.
Optimized Legend items measurement and cache.
Ability to specify the type of exported EMF format - EmfPlus, EmfDual or EmfOnly.
Ability to specifify modifier keys for drag tools (NMouseAction also accepts a collection of modifier keys).
Added support for texture filling content alignment
The new version features fixes all reported problems as well numerous small performance improvements in the control.
Nevron Vision for .NET now provides full support for Visual Studio 2017!
The best way to understand the power of Nevron Vision for .NET is to test it yourself. This is why we provide a
fully functional 60 days free evaluation with no obligations whatsoever.
Founded in 1998, Nevron Software is a component vendor specialized in the development of premium presentation layer solutions for .NET based technologies.
Today Nevron has established itself as the trusted partner worldwide for use in .NET LOB applications, SharePoint portals and Reporting solutions.
Nevron technology is used by many Fortune 500 companies, large financial institutions, global IT consultancies, academic institutions, governments and non-profits.

 Open Vision for .NET
 NOV Chart for .NET
 NOV Diagram for .NET
 NOV Rich Text Editor for .NET
 NOV Grid for .NET
 NOV Schedule for .NET
 NOV Gauge for .NET
 NOV Barcode for .NET
 NOV User Interface for .NET
 Vision for .NET
 Chart for .NET
 Diagram for .NET
 User Interface for .NET
 Vision for SSRS
 Chart for SSRS
 Gauge for SSRS
 Map for SSRS
 Barcode for SSRS
 Vision for SharePoint
 Chart for SharePoint
 Gauge for SharePoint
 Map for SharePoint
 Barcode for SharePoint