|
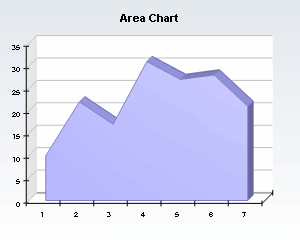 | The Standard area charts show only one series. The variations of this chart include changing the origin of the area, as well as showing or hiding the drop lines and displaying the area segments with different filling. |
|
|
![Area chart with drop lines]() | The Standard area charts only show one series. The variations of this chart include changing the origin of the area, as well as showing or hiding the drop lines and displaying the area segments with different filling. |
|
|
![Area chart with different segment filling]() | The Standard area charts only show one series. The variations of this chart include changing the origin of the area, as well as showing or hiding the drop lines and displaying the area segments with different filling. |
|
|
![Area chart with custom origin]() | The Standard area charts only show one series. The variations of this chart include changing the origin of the area, as well as showing or hiding the drop lines and displaying the area segments with different filling. |
|
|
![Milti series area chart with 3d projection and lighting]() | Multi series area charts display several series from the 3DChart component data storage. They are often displayed in 3D. |
|
|
![Area chart with date time categories axis]() | Date-Time area charts are created when the user specifies an exact X position for the area data points. This feature is especially useful when the X positions are in date-time format. |
|
|
![Area chart in stairs mode]() | Area Charts can also be displayed in Stairs mode. This type of area chart is often called histogram chart. |
|
|
![Stack area with different fill effects]() | Simple stack area charts have several data series. The variations of this chart include showing or hiding the drop lines between the area segments and changing the filling of the stacks. |
|
|
![Stacked percent area chart]() | Stack percent area charts are created when the user changes the stack style of the area chart to stacked percent. |
|
|
![Stack area chart in stairs mode]() | This kind of stack area chart is created when the user displays the stacked areas in stairs mode. |
|
|


