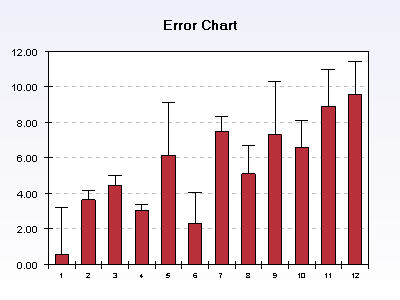
The 3DChart component can display error bar charts. The component displays the error relative to a base value. The base value is represented with a bar. Lots of different styles are supported. The user can display the data points at arbitrary x positions. Variations of the error bar charts most often include changing the style of the error line or the style of the error bar. |