|
 | The function presentation group is a powerful and flexible tool for creating and displaying various mathematical, statistical and financial functions. There are more than 20 built-in functions, which you can use directly, or combine in custom expressions, to evaluate more complex formulas. Functions are represented as standard line charts with numerous properties, which control the line style, line appearance and position of data points. |
|
|
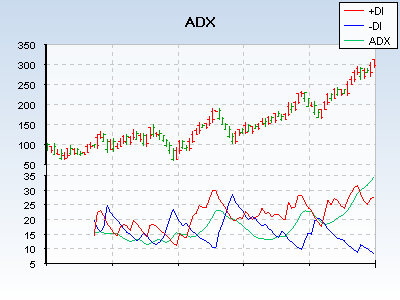
![Stock chart]() | The function presentation group is a powerful and flexible tool for creating and displaying various mathematical, statistical and financial functions. There are more than 20 built-in functions, which you can use directly, or combine in custom expressions, to evaluate more complex formulas. Functions are represented as standard line charts with numerous properties, which control the line style, line appearance and position of data points. |
|
|

