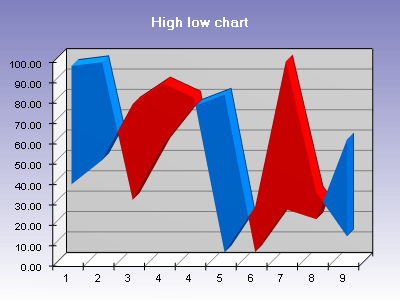
 | The 3DChart component can display High-Low charts. The depth of the high-low area can be controlled as percent of the series depth. The user can control the appearance and visibility of the drop lines, separating the high-low area segments. Variations include changing the depth of the area, as well as changing the appearance and transparency of the high-low areas. |

