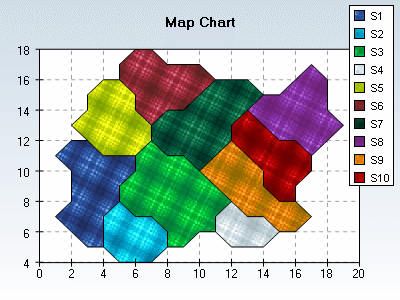
 | Map charts represent a set of user defined polygons. The user can apply fill effects, material and border properties to the polygons, as well as use an automatic or user defined palette. Since each of the polygons has an assigned value, this value is used in the determination of the palette color used to fill the polygon. There are no restrictions on the polygons displayed by the NMapPresentGroup - they can be non-convex and self intersecting. |

