|
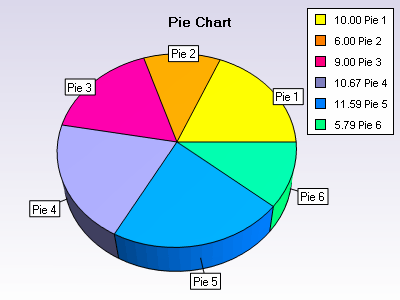 | The 3DChart component can display pie charts. The shape of the chart can be a torus, pie or smooth edge pie. The user can control the begin angle, depth, pie radius and total pie angle. Grouping of small slices below a specified value or percent can also be performed. The pie slices can be sorted in ascending or descending manner. |
|
|
![Pie chart with torus segments]() | The 3DChart component can display pie charts. The shape of the chart can be a torus, pie or smooth edge pie. The user can control the begin angle, depth, pie radius and total pie angle. Grouping of small slices below a specified value or percent can also be performed. The pie slices can be sorted in ascending or descending manner. |
|
|
![Smooth edge pie with detached segment]() | The 3DChart component can display pie charts. The shape of the chart can be a torus, pie or smooth edge pie. The user can control the begin angle, depth, pie radius and total pie angle. Grouping of small slices below a specified value or percent can also be performed. The pie slices can be sorted in ascending or descending manner. |
|
|
![Grouping pie segments according to some criteria]() | With pie grouping the user can increase the readability of the pie charts when a pie has numerous smaller slices. The user has full control over various properties of the pie created after the accumulation of slices that meet certain criteria. |
|
|


