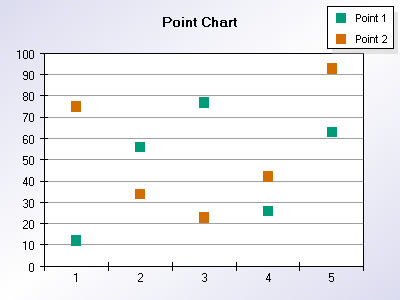
 | The 3DChart component can display classical point charts. The shape of the value point marks can be a bar, cylinder, cone, inverted cone, pyramid, inverted pyramid, sphere, circle, diamond, cross, diagonal cross or star. It can also be configured as an XY or XYZ scatter plot. Join-lines connecting the data points with the chart walls can also be displayed. Simple point charts are created with one or more data series. The variations of this chart type include changing the style and the appearance of the value point marks. |


