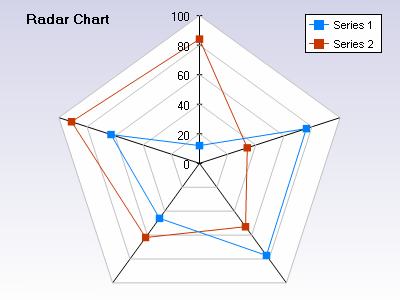
 | The 3DChart component can display radar charts (spider charts). The user can show data point marks on individual data items, as well as fill the area surrounded by the data points (filled area radar chart). The X and Y radiuses are easily controlled. Category texts provide control over detachment and appearance. Filled area radar charts are visualized when the user sets the style of the radar to Filled Area. |

