Nevron Logo

Working with Nevron Chart for .NET – Using Axis Scales White Paper

Working with NOV Chart – Using Axis Scales

Introduction

Charts are plotted using axes that scale the data displayed on the chart plot area along one or more dimensions. There are several types of charts that define the possible number of dimensions –those are:

Cartesian Charts – this is the most common type of chart that allows the user to plot data against two or three dimensions.
Polar Charts – this type of chart plots the data along a cyclical axis (angle) and a value axis.
Ternary Chart – this type of chart plots the data along three dimensions.
Radar Chart – this type of chart plots the data along a separate dimension for each category in the provided data points.

The common in those charts is that each chart dimension can represent a different quantity or measurement where each value in the respective dimension of a data point is positioned. To show the user the values in a particular dimension, Nevron .NET Chart supports several axis scales that aim to denote the values along this dimension to annotate those values using axis scale objects, such as labels, ticks, and grid lines, stipes, and others.
The component distinguishes among several scale types, such as Categorical, Numeric, and Date/Time, where each scale has many options to enhance the annotation of such data.

Features

Each axis in control has a scale that defines how the data scaled on it is plotted on the chart area and how values on the scale are annotated. Two major scale types determine how the control will scale categorical (discrete) values and numeric (continuous) ones. The type of scale used by a particular axis is controlled by the ScaleConfigurator property of the respective axis.

Scale Types

Chart

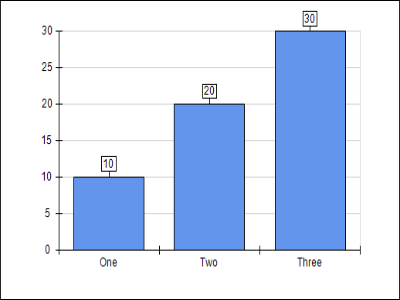
Fig.1 Chart with a Categorical Scale

Categorical Scale
Categorical scales are used to scale discrete values. Common examples of such values are all types of string data such as company name, region, city, etc. The most common task you need to perform on categorical scales is to change the default category annotation (0, 1, 2, etc.). For example, consider the following chart where the default category labels are replaced with custom ones (“One”, “Two”, “Three”). To achieve this chart, you have to write the following code:

NCartesianChart chart = (NCartesianChart)nChartControl1.Charts[0];

// hide the legend
NLegend legend = nChartControl1.Legends[0];
legend.Visible = false;

// make a square chart
NBarSeries bar = new NBarSeries();
bar.Values.Add(10);
bar.Values.Add(20);
bar.Values.Add(30);
bar.Values.Add(bar);

// get a reference to the ordinal scale of the X axis
NOrdinalScaleConfigurator scaleX = chart.Axis(StandardAxis.PrimaryX).ScaleConfigurator as NOrdinalScaleConfigurator;

// replace the default labels with custom ones
scaleX.AutoLabels = false;
scaleX.Labels.Add("One");
scaleX.Labels.Add("Two");
scaleX.Labels.Add("Three");


Chart Linear Scale

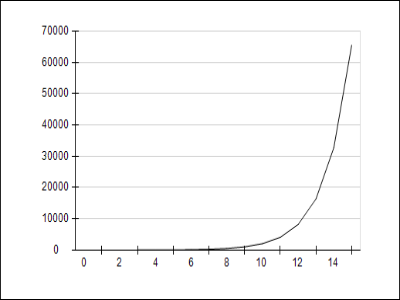
Fig.2 Chart with a linear scale showing an exponential function

Numeric Scale
Numeric scales are used to scale numeric (continuous) data. Different numeric scales address the specifics of the major types of numeric data - number, angle, and date/time.


Chart Log Scale

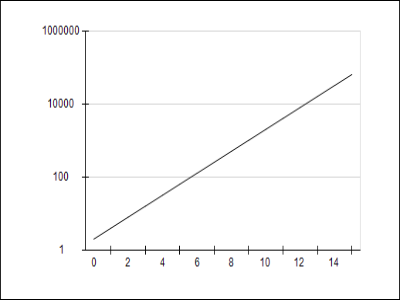
Fig.3 Chart with a logarithmic scale showing an exponential function

Linear and Log Scales
Linear and log scales are the two most commonly used numeric scales. Both typically appear along the Y axes and the X/Depth axes in case the control shows an XY/XYZ scatter chart. The pictures from Fig.2 and Fig.3 show two charts with the same data – the powers of 2 represented as a line chart. The first one uses a standard linear scale, and the second one is a logarithmic scale.

The following code shows how to replicate the above chart (a chart with log scale and custom logarithmic step for the Y-axis):

NCartesianChart chart = (NCartesianChart)nChartControl1.Charts[0];

// hide the legend
NLegend legend = nChartControl1.Legends[0];
legend.Visible = false;

// make a square chart
chart.BoundsMode = BoundsMode.Stretch;

// create a line series
NLineSeries line = new NLineSeries();
double baseValue = 2;
line.DataLabelStyle.Visible = false;

for (int i = 0; i < 16; i++)
{
line.Values.Add(baseValue);
baseValue *= 2;
}
chart.Series.Add(line);

NLogarithmicScaleConfigurator logScale = new NLogarithmicScaleConfigurator();
logScale.MajorTickMode = MajorTickMode.CustomStep;
logScale.CustomStep = 2;
logScale.MajorGridStyle.SetShowAtWall(ChartWallType.Back, true);

chart.Axis(StandardAxis.PrimaryY).ScaleConfigurator = logScale;
Date Time Scale

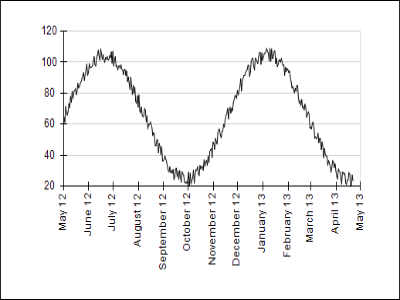
Fig.4 Chart annotated with a step of one month

Date/Time Scales
Date/Time scales are used to display information about data points with date/time coordinates (most commonly X coordinate) and are similar to linear numeric scales. The difference is that Date/Time annotation is more complex than numeric scale annotation because specific date units are not regularly spaced apart - for example - the duration of one month varies depending on the month, and in the case of February, depending on the year.
Nevron Chart supports all commonly used date time scales, including some widely used in financial and project management applications. .

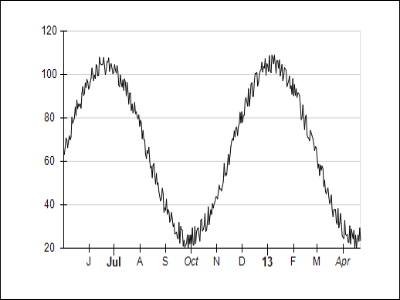
The date-time scale annotates a date-time range with a step that is multiple of a single date-time unit (one day, two days, one month, etc.). The picture in Fig.4 shows a chart annotated with a step of one month.

This chart is achieved with the following code:

NCartesianChart chart = (NCartesianChart)nChartControl1.Charts[0];

// hide the legend
NLegend legend = nChartControl1.Legends[0];
legend.Visible = false;

// make a square chart
chart.BoundsMode = BoundsMode.Stretch;

// create a line series
NLineSeries line = new NLineSeries();

Random rand = new Random();
line.DataLabelStyle.Visible = false;

// the line uses x values (date/time)
line.UseXValues = true;

DateTime now = DateTime.Now; for (int i = 0; i < 356; i++) {
line.Values.Add(Math.Sin(2 * Math.PI * (i / 200.0)) * 40 + rand.Next(10) + 60);
line.XValues.Add(now);

// add one day
now += new TimeSpan(1, 0, 0, 0);
}

chart.Series.Add(line);

chart.Series.Add(line);

// switch the x axis to date / time
NDateTimeScaleConfigurator dateTimeScale = new NDateTimeScaleConfigurator();
dateTimeScale.LabelStyle.Angle = new NScaleLabelAngle(ScaleLabelAngleMode.View, 90);
dateTimeScale.LabelStyle.ContentAlignment = ContentAlignment.TopCenter;
chart.Axis(StandardAxis.PrimaryX).ScaleConfigurator = dateTimeScale;

Value Timeline Chart

Fig.5 Value Timeline Scale

Note that the line series contains date-time values in its XValues data series, and the X-axis uses a date time scale. In addition, the above code shows how to use vertical texts on the axis to improve the readability of longer labels.
Although this date/time annotation of the scale is correct, it is not very informative because it will not highlight important date/time events on the scale, such as quarter and year change. In financial and project management applications, it is common to use a more advanced date/time scale type – the value and range timeline scale.
The chart in Fig.5 is the same but uses a value timeline scale. Note how the scale has highlighted the half-year, quarter, and year date time events on the chart while keeping month information compact. The same chart using a range timeline scale – this scale uses more space but is more readable. The user can clearly identify the beginning and each period depending on the selected units for annotation – a month for the first level, a quarter for the second, and a half year for the third. To achieve one of the above you simply have to assign a different scale to the x axis:

chart.Axis(StandardAxis.PrimaryX).ScaleConfigurator = new NValueTimelineScaleConfigurator();


Scale Decorations
All scale types support control over how the scale is decorated - for example, axis title, scale ticks color and density, label formatting, etc. In addition, scales provide control over annotations that show on the chart plot – such as grid lines and stripes, which further improve the chart’s readability.

Axis Title
The most common scale annotation supported by all scales is the axis title. To change the scale title, you need to touch the scale configurator Title.Text property:

chart.Axis(StandardAxis.PrimaryX).ScaleConfigurator.Title.Text = "X Axis";
This is common for all axis types.

Label and Tick Density
All scale types support control over the tick/label density of the axis, and there are many available options. The following code shows how easy it is to set the tick step of the Y numeric axis to a fixed step of 10:

[C#]
NLinearScaleConfigurator scaleY = chart.Axis(StandardAxis.PrimaryY).ScaleConfigurator as NLinearScaleConfigurator;
scaleY.MajorTickMode = MajorTickMode.CustomStep;
scaleY.CustomStep = 10;

Gridlines
Grid lines extend from the ticks displayed on the axis and extend along the chart plot. Their objective is to mark the values for the user reading the chart. The following code shows the major gridlines on the back chart wall:

chart.Axis(StandardAxis.PrimaryX).ScaleConfigurator.MajorGridStyle.SetShowAtWall(ChartWallType.Back, true);

There are many other options related to scales, such as control over the label formatting, style of the axis ruler, it begin/end caps, etc.

Conclusion

Nevron Chart supports all major scale types with many options and customizations that are completely programmable with C# and VB.NET code. If you want to learn more about this component, we recommend you download the fully functional evaluation of the Nevron Open Vision suite.
  • Categorical, Linear, Logarithmic, and Date time scales.
  • Wide variety of appearance styles and properties.
  • Automatic fitting/positioning of labels.
  • Custom label support, with multiple label rows.
  • Chart plot annotations like gridlines, stripes, and interlaced stripes.
The complete list of features is outside the scope of this article. However, suffice to say, the level of attention and number of customization options in every scale type makes Nevron Chart for .NET the leading chart component in respect.

About Nevron Software

Founded in 1998, Nevron Software is a component vendor specialized in the development of premium presentation layer solutions for .NET based technologies. Today Nevron has established itself as the trusted partner worldwide for use in .NET LOB applications, SharePoint portals and Reporting solutions. Nevron technology is used by many Fortune 500 companies, large financial institutions, global IT consultancies, academic institutions, governments and non-profits.
For more information, visit: www.nevron.com.