Nevron Logo

Working with XYZ Scatter Graphs

Working with Nevron Chart for .NET - XYZ Scatter Graphs

Introduction

The requirements for presentation charts are always high and very often simple bars and lines are not enough to impress the audience. The rich feature set of Nevron Chart for .NET enables you to go beyond the limits of "ordinary" charts and opens a field of action for your imagination.

In this whitepaper you can track the process of creating a chart that presents data for the Carbon Dioxide emissions of European countries. We will try to get the most out of the component and set up a chart that is interesting, attractive and informative.

Data

Table 1

Fig. 1

First we have to examine the structure of the data and choose an appropriate form of representation.

The data source contains entries for 10 countries, where the following values are provided per country:

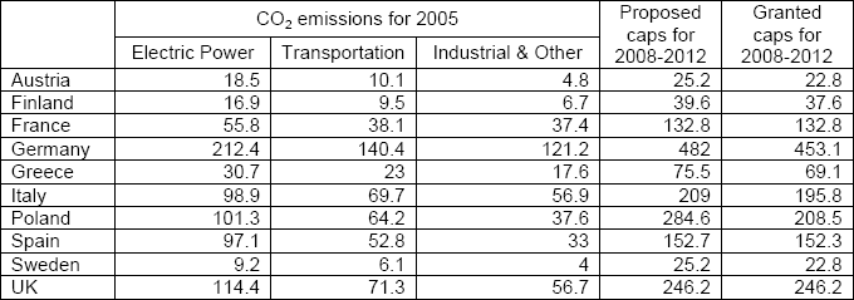
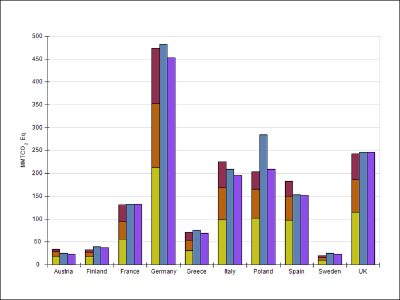
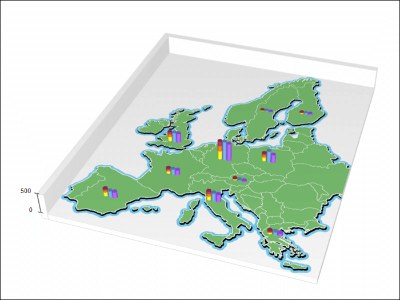
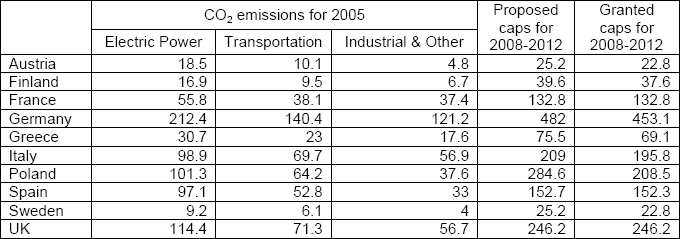
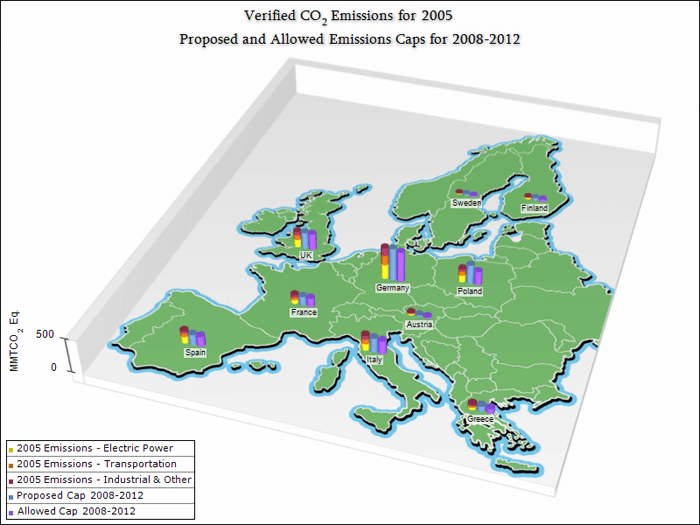
1. Actual CO2 emissions for the year 2005, measured in Million Metric Tons of CO2 Equivalent (MMTCO2). They are split into three categories by economy sectors that are major sources of energy-related CO2:
  • Electric Power Production
  • Transportation
  • Industrial, Commercial and Residential
2. Proposed emissions caps for the period 2008-2012 (MMTCO2 per year).

3. Granted emissions caps by the European commission for the same period (MMTCO2 per year).

Chart

xyz Scatter Chart 1

Fig. 2

The values in the first three columns add up to the total emissions for the year 2005, so they can be naturally represented as a stack. The fourth and the fifth values can be placed next to the stack, so that the proposed and granted emissions caps can be easily compared to the actual emissions. The cluster-stack combination that is formed can be displayed as a 2D plot (Fig. 2):


xyz Scatter Chart 2

Fig. 3

An interesting idea is to make the chart 3-Dimensional and place the bars on top of the Europe map. For this purpose we'll create a Mesh surface series and texture it with a pre-rendered image of the Europe map (Fig. 3). We'll also set the ratio of the X:Z chart dimensions to be equal to the X:Y ratio of the map image, so that the map is not distorted. For example if the image size is 540 x 650 pixels, we set the chart width to 54 and the chart depth to 65.


xyz Scatter Chart 3

Fig. 4

The XYZ cluster bar chart is a unique feature of Nevron Chart for .NET. It gives us the ability to place each cluster at arbitrary positions along the X and Z axes. We just have to fill the X and Z values in the first bar series of the cluster and set the UseXValues and UseZValues properties of the series to true.

The Y axis shouldn't be very long because otherwise the bars will get taller and will obstruct greater part of the image. With shorter bars the readability is decreased a little bit compared to the 2D chart, but in return we have a chart that looks really impressive (Fig. 4).


xyz Scatter Chart 4

Fig. 5

Only a few finishing touches remain before the chart is complete. We'll place a title above the chart and a legend that explains the color coding of the bars. The built-in xml formatted texts will come helpful for splitting the long title into two lines and displaying the subscript in "CO2". A soft blurred shadow behind the title gives depth to the final image (Fig. 5).

Nevron Chart for .NET has support for XYZ Scatter Stack/Cluster Bars, Line, Smooth Line, Point, Bubble, Shape and Error Bar Graphs.

Conclusion

Nevron Chart for .NET is in a class of its own when it comes to displaying true 3D charts like surface plots and XYZ scatters. The component offers a wide range of charting types with variety of applications and can be used for the creation of presentation charts with great visual impact. More information about the discussed features is available in the Users Guide shipped with the fully functional evaluation of the Chart component.

About Nevron Software

Founded in 1998, Nevron Software is a component vendor specialized in the development of premium presentation layer solutions for .NET based technologies. Today Nevron has established itself as the trusted partner worldwide for use in .NET LOB applications, SharePoint portals and Reporting solutions. Nevron technology is used by many Fortune 500 companies, large financial institutions, global IT consultancies, academic institutions, governments and non-profits.
For more information, visit: www.nevron.com.

Customer Quotes:

QUOTE After evaluating several charting tools for WinForms ([another chart vendor], [another chart vendor], [another chart vendor] and the Chart coming with VS Net 2008), Nevron Chart offers clearly the best performance for high volume data visualisation. Furthermore the support offered the fastest response by far and was really helpful. Very good value for the money. UNQUOTE

Joern Kunze, Dipl.-Ing.
advanced data processing GmbH