ProductsAll Products
.NET Components
DownloadsAll Downloads
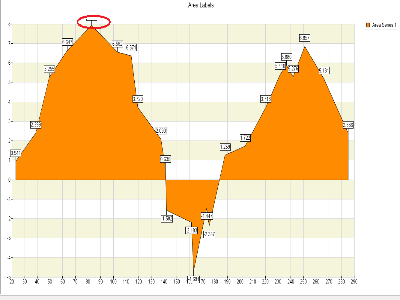
All types of charts support automatic Data Label Layout. It is performed in two stages that can work independently or in combination. By default, both layout stages are disabled. They are activated on a per-chart basis, so all data point labels displayed in a given chart are subject to the automatic layout.
The first layout stage is called Initial Positioning. Initial Positioning aims to select a position for each label from a set of proposed locations situated around the origin point of the label. The control determines the location that causes minimum potential conflicts with other label locations.
It can be enabled with the following code:
We can continue with the label adjustment.
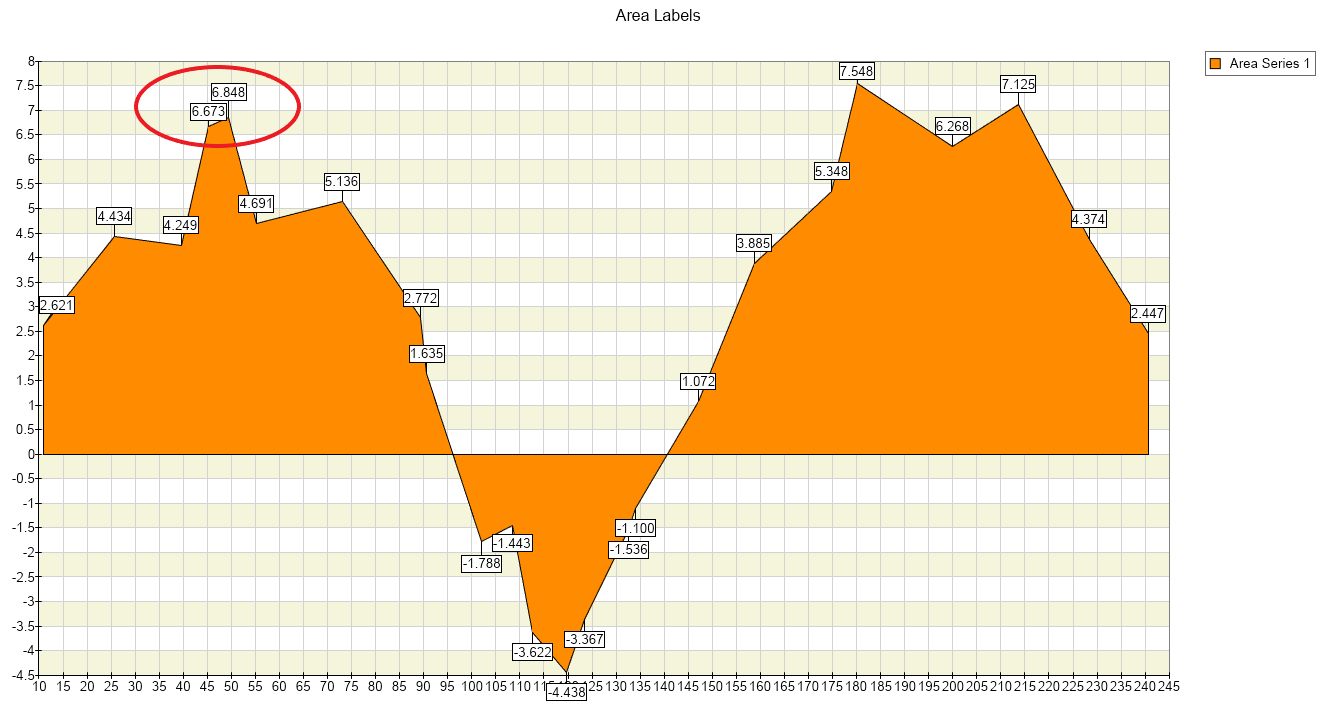
Label Adjustment removes overlaps by shifting the overlapping labels apart from each other, using a force-directed layout algorithm. The functionality of label adjustment can be used regardless of whether initial positioning is enabled or not. Label adjustment cannot be disabled per series basis - it applies to all data labels in the chart.
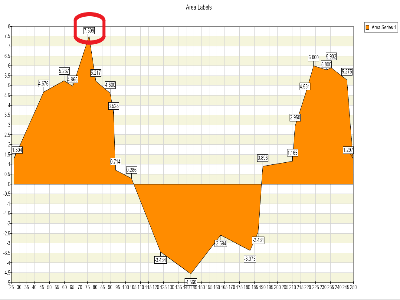
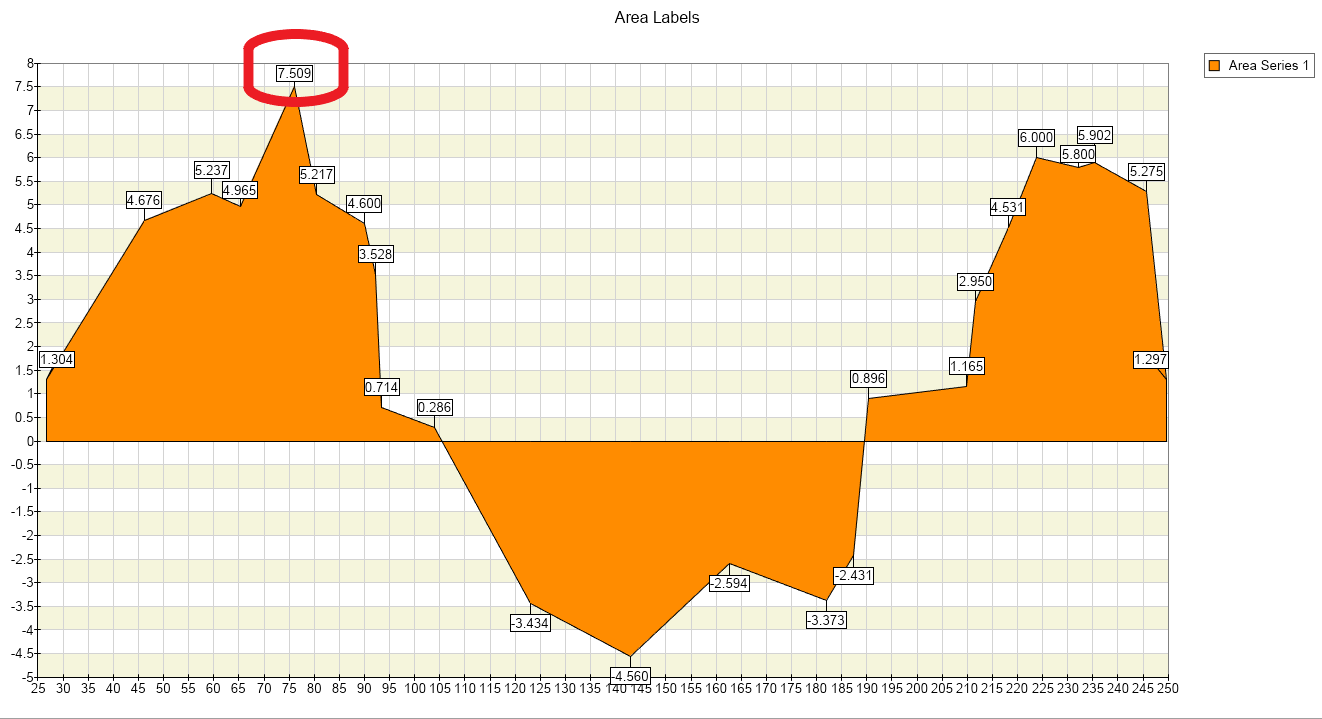
And finally, the last touch is setting the data point safeguard. Data Point Safeguard is necessary functionality since it protects the data points from being too close to each other. It can be enabled or disabled on a per series basis with the following code:
// enable the data point safeguardIn addition, you can specify the distance around the labels by using the DataPointSafeguardSize property.
// set safeguard sizeAutomatic data label layout is critical in presenting large data sets that must be labeled accurately. The automatic layout functionality in NOV Chart for .NET aims to ensure maximum readability for chart elements by preventing data point labels from overlapping with each other and the data points themselves.